6. Chapter 6: Post-processor Programs
There are four post-processor programs: FLO-2D MapCrafter, MAXPLOT, HYDROG and PROFILES that display the output data graphically. FLO-2D MapCrafter and MAXPLOT display the flood inundation depth and velocity plots. Channel flood simulations or floodplain cross-sections are required to view hydrographs in HYDROG. A channel model is also required to view the channel water surface profiles in PROFILES. These programs can be initiated by clicking on their names in the File pull down menu in the FLO-2D Plugin or by copying the executable (*.EXE) file into the project subdirectory and double clicking on the program name in a file browser.
6.1. HYDROG
Channel output hydrographs, floodplain cross-section hydrographs, and hydraulic structure hydrographs can be viewed with the HYDROG program. It displays the hydrograph for every channel element in the system. It will also list the average channel hydraulic data for various reaches of river. Gaging station hydrograph data can be plotted along with the FLO-2D predicted hydrograph by creating the optional HYDRO.DAT file in the following format:
HYDRO.DAT File Descriptors
3                  Line 1: Number of gaging station with hydrograph data
Haynor             Line 2: Name of gaging station (10 letters)
13160    251       Line 3: Channel grid element and # of hydrograph pairs
0.00   1287.85     Line 4: Hydrograph pairs time(hours) discharge (cfs)
1.00   1285.47     Line 4: Hydrograph pairs time(hours) discharge (cfs)

Notes:
 Line 2 - 4:  These lines are repeated for each gaging station.
HYDRO.DAT File Example
Haynor
13160  251
0.00  1287.85
1.00  1285.47
2.00  1295.01
3.05  1302.20
...
After opening HYDROG, click on either ‘Plot Channel Hydrographs’, ‘Plot Cross-Section Hydrographs,’ or ‘Compute Hydraulics’ in the Main Menu shown below:
Click on ‘Plot Channel Hydrographs’ a dialog box appears to select either a channel segment or element:
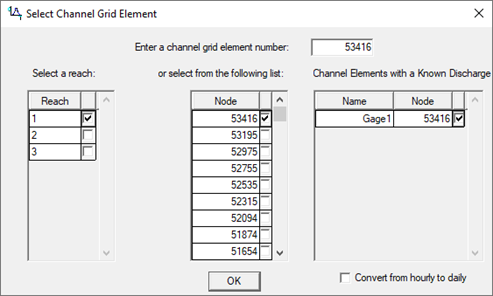
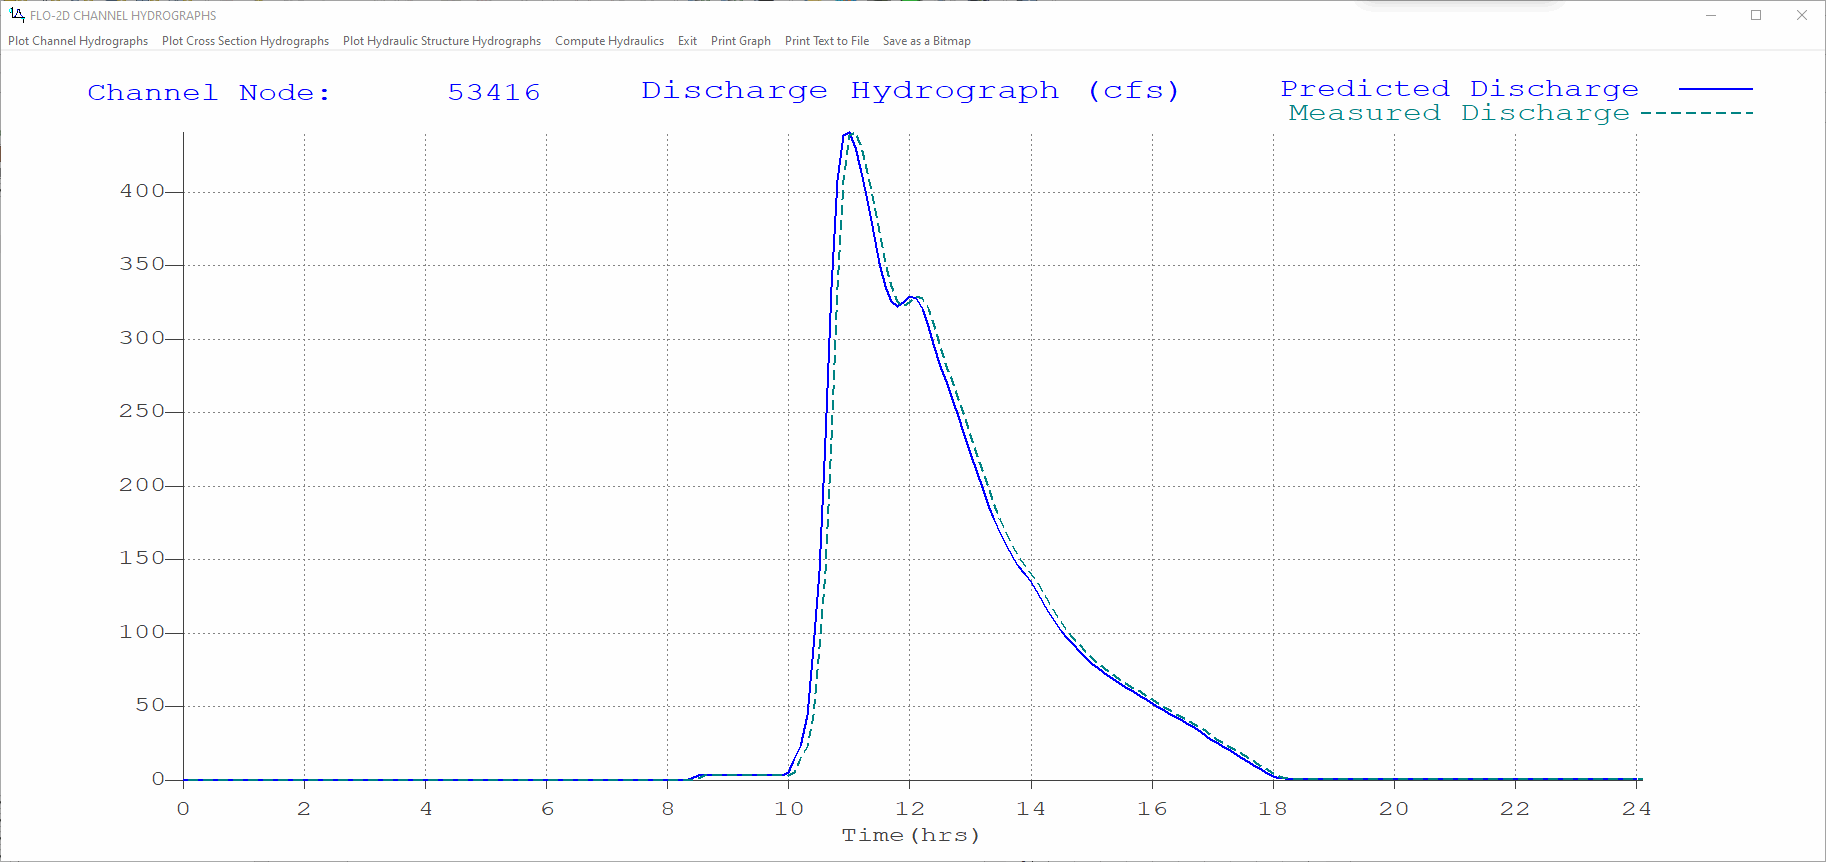
After selecting the channel element and clicking ‘OK’, the hydrograph is plotted as shown in the following figure. Use the dialog box in the upper right portion of the screen to select another channel element or to return to the channel element list or main menu.
If the ‘Compute Hydraulics’ is selected from the Main Menu, the following dialog box is displayed:
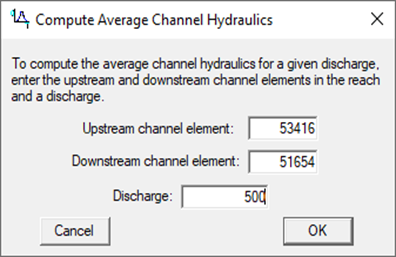
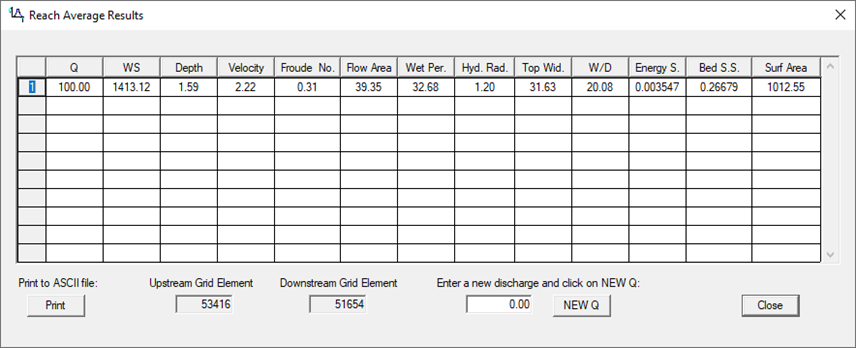
After entering the three data fields in the dialog box (including the desired discharge for computing the average channel hydraulics, mouse click ‘OK’ to display the following table:
This table displays the average discharge weighted hydraulic conditions for the given discharge between the two channel elements (inclusive). From this dialog box, select a new discharge and add to the table or print this table to an ASCII file (HYDR.OUT).
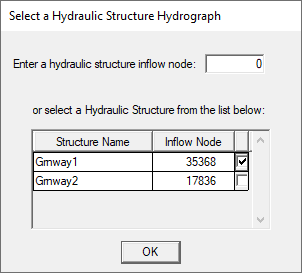
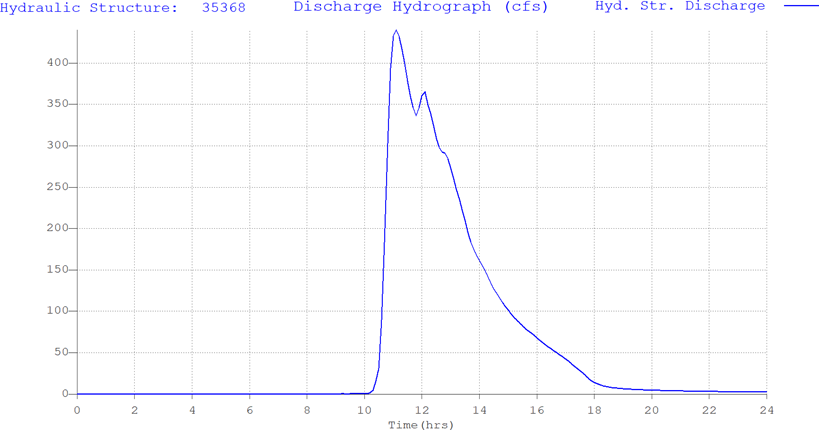
Similar hydrographs can be plotted for floodplain cross-section selected in the HYCROSS.OUT and Hydraulic Structure hydrographs in HYDROSTRUCT.OUT. If the file exists, the cross-section hydrograph for the selected cross-section elements and flow direction will plotted using the second command on the Main Menu bar.
6.2. FLO-2D MapCrafter
FLO-2D MapCrafter is the primary post processing tool for FLO-2D software. It is a QGIS plugin and can be accessed via the QGIS Plugin Directory using the Plugin Manager. The MapCrafter documentation is maintained on the MapCrafter wiki.
FLO-2D MapCrafter WikiMapCrafter allows users to visualize FLO-2D results in a GIS environment. Users can create flood inundation maps, velocity maps, and other thematic maps based on FLO-2D simulation outputs.
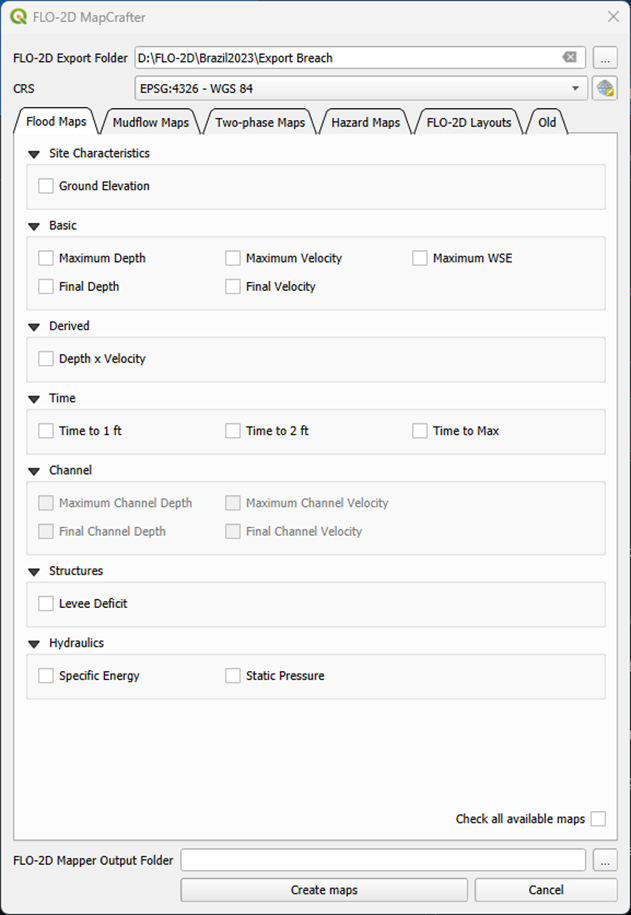
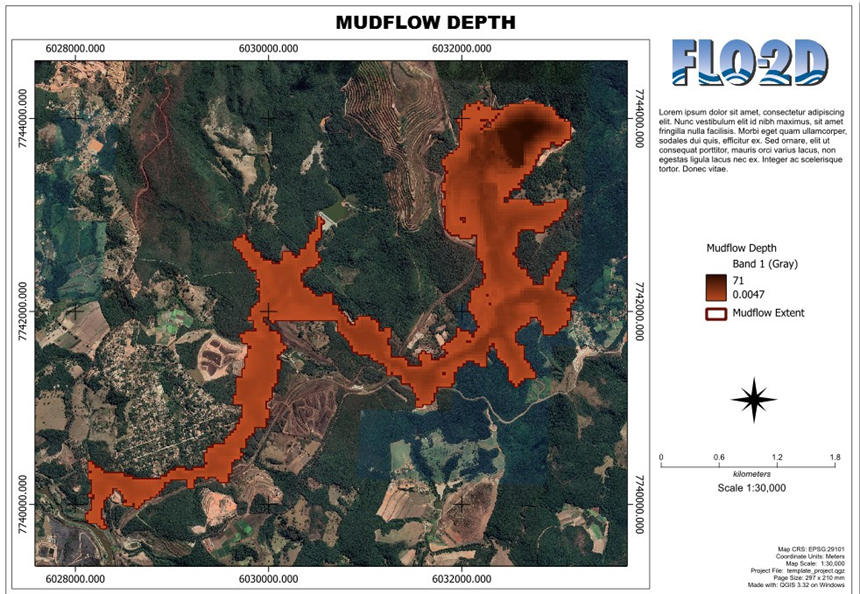
In addition to mapping FLO-2D results, MapCrafter can also help users design map layouts for printing high resolution mapping pdfs.
6.3. Mapper Pro
MAPPER Pro is a post-processor program that creates high resolution maps and plots of the FLO-2D model results including area of inundation, time variation of hydraulic variables, maximum water surface elevations, duration of inundation, impact force, static pressure, specific energy, sediment scour or deposition and others. As of October 2023, the GDS and MAPPER Pro are now distributed separately from FLO-2D. These tools are aging and their Visual Basic code has an unknown life limit via Microsoft. If a user requires these tools, they can be downloaded via the FLO-2D Shapefile account. MAPPER Pro is a post-processing program for viewing the FLO-2D simulation results. Three types of plots can be generated:
Grid element plots where each element is assigned a color depending on the value of the selected plot variable.
Line and shaded contour maps based on the grid element values.
DTM point depth plots to generate detailed flow depth contour maps based on grid element water surface elevations and DTM point ground elevations.
The MAPPER Pro manual describes the commands and tools and provides instruction.
6.4. MaxPlot
The MAXPLOT program is a basic graphical tool to display the grid element maximum depths and velocities. MAXPLOT is a simple alternative to MAPPER Pro that quickly displays plots of the maximum floodplain and channel depths, maximum street velocity, final floodplain depths and others. It is faster than MAPPER Pro but has less graphical resolution and fewer display options. Use MAXPLOT for a quick overview of predicted flow depths and velocities. By zooming in on a given plot, the grid element number, maximum flow depth or velocity and the maximum water surface elevation can be viewed. The tool bar has options for view extents, previous view, pan, a coarse flood contour and 3-D plot and an option to save the view as a bitmap.

MAXPLOT can be initiated by copying the program to the project folder and double clicking it. After opening MAXPLOT a blank screen appears with a Main Menu:
Click on ‘Open’ to display the following the dialog box:
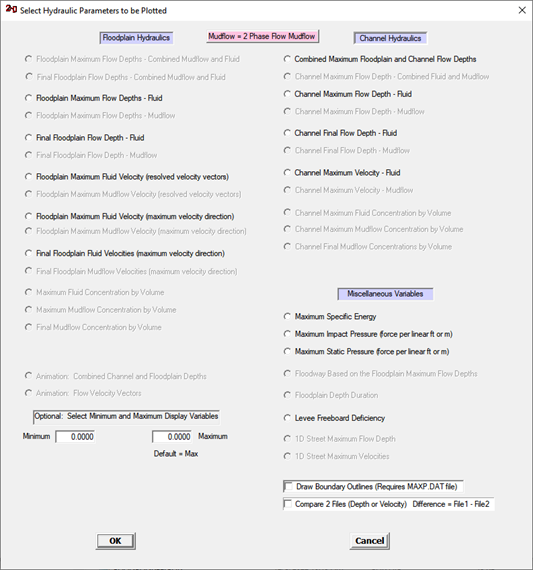
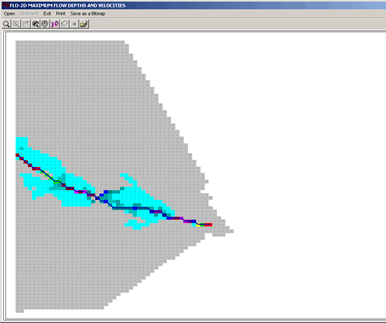
Activate one of the plots listed in the dialog box above by clicking on the radio button in front of the plot option and clicking the ‘OK’ button. Set limits on the minimum and maximum depths or velocities to display. The following plot displays the combined channel and floodplain maximum flow depth for the Monroe project example.
6.5. Profiles
The PROFILES program serves the dual purpose of being a pre- and post-processor program for 1D channels. As a post-processor program, it will display a channel water surface and bed elevation for any FLO-2D simulation output interval. In order to view the predicted water surface elevation in PROFILES, it is necessary to run a FLO-2D channel simulation first. The PROFILES program has zoom and print options to assist in reviewing the results.
To view the predicted water surface profiles, click on ‘View Profiles’ in the Main Menu and a dialog box appears:
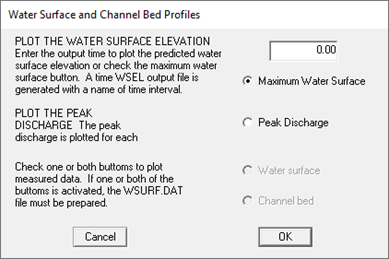
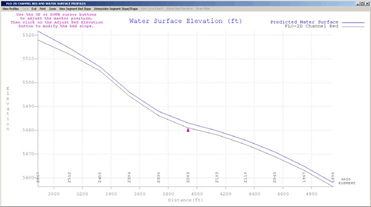
To view the predicted maximum water surface elevation profile, click on the radio button labeled ‘Maximum Water Surface’ and click ‘OK’. Plot the water surface at any output interval by entering the time in the text box in the upper right corner. The peak discharge can also be plotted as a function of the channel distance. To plot the surveyed or measured, the WSURF.DAT must be prepared. The file format is presented at the end of this section of the manual.
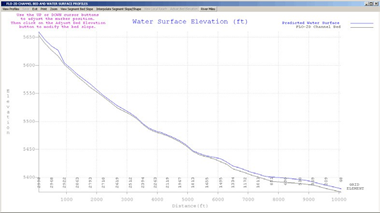
There are several options on the Main Menu. Zoom in on given river reach, print the image or label the distance along the channel in river miles. The zoom view is shown in the following figure:
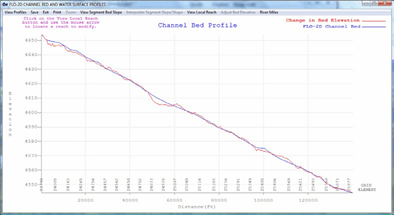
If sediment transport has been simulated, PROFILES will plot the final bed elevation and the cross-section geometry changes associated with either scour or deposition. The image below displays sediment deposition and scour in a reach of the Middle Rio Grande in New Mexico.
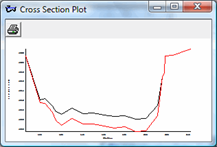
Non-uniform sediment distribution on the channel bed can be viewed when the channel flow is simulated. The cross-section plot below displays the final cross-section elevations in red compared to the cross-section elevations at the start of the flood simulation shown in black. This image can be expanded to full view.
The user has an option in the water surface dialog box of plotting the surveyed water surface and bed elevations along with the predicted values. To plot the surveyed water surface or channel bed elevation, the WSURF.DAT file must be created in the following format:
Optional WSURF.DAT file format:
Please note that PROFILES also has options for editing the channel bed slope and thalweg flow depth and for interpolating the slope and cross-section geometry for the cross-section option. Refer the section on Pre-Processor Programs for a discussion on these features.
WSURF.DAT File Descriptors
2045             Line 1: # of channel elements with a surveyed ws elev.
4 4152.22        Line 2: Grid Element WS elevation
8 4151.84        Line 2: Grid Element WS elevation
...

Notes:
 Line 2: This line is repeated for each channel element with a surveyed ws elevation.
WSURF.DAT File Example
2045
4 4152.22
8 4151.84
12 4151.69
15 4151.55
19 4151.41
...
The surveyed water surface can also be compared directly with the FLO-2D computed water surface in the WSTIME.OUT (see file description in the output file section) by creating a WSTIME.DAT file. The WSTIME.DAT file format is as follows:
WSTIME.DAT File Descriptors
49                           Line 1: # of channel elements with a surveyed ws elev.
117632 4658.95 240           Line 2: Grid Element WS elevation Time
117928 4655.80 240           Line 2: Grid Element WS elevation
...
Notes:
 Line 2: This line is repeated for each data set.
The WSTIME.OUT file will contain:
Channel element number, time of survey (hrs), surveyed water surface elevation, computed water surface elevation, difference between the surveyed and computed water surface and cumulative difference between the surveyed and computed water surface elevations.
WSTIME.DAT File Example
49
117632 4658.95 240
117928 4655.80 240
119882 4652.28 240
120580 4650.36 240
120915 4648.52 240
...