FLO-2D Results Tool
The results tool is used to see results by location for specific components.
Connect to the Data
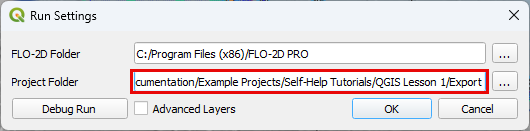
Start by loading the completed simulation folder into the Run FLO-2D - Settings Tool.
Note
The FLO-2D Project folder is updated everytime that files are exported. Double check path before using the tool.
Activate the Tool
The tool is a toggle. Click FLO-2D Results button to activate it.

Click on any component on the map. If the component has active results, a selector will appear.
Click the plotting panel to select the data to be plotted.
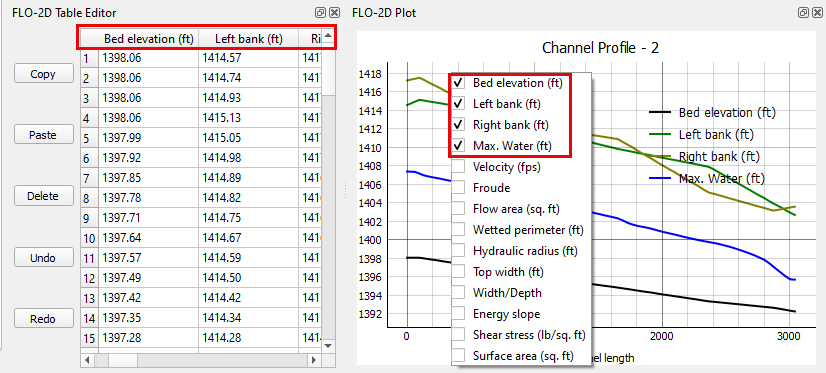
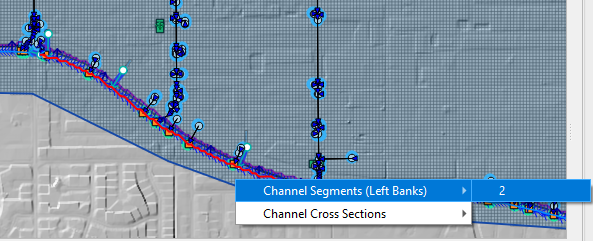
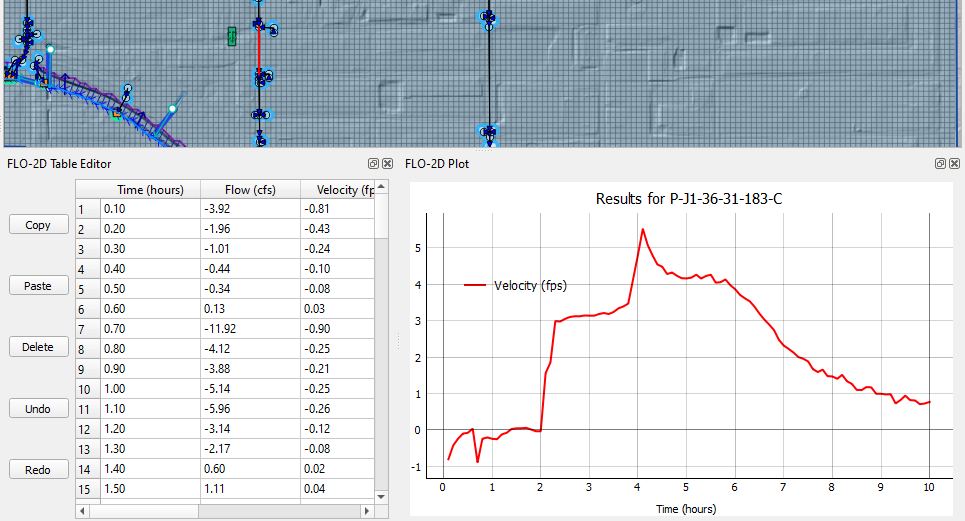
Channel Results
Click a left bank line to plot the water elevation profile.
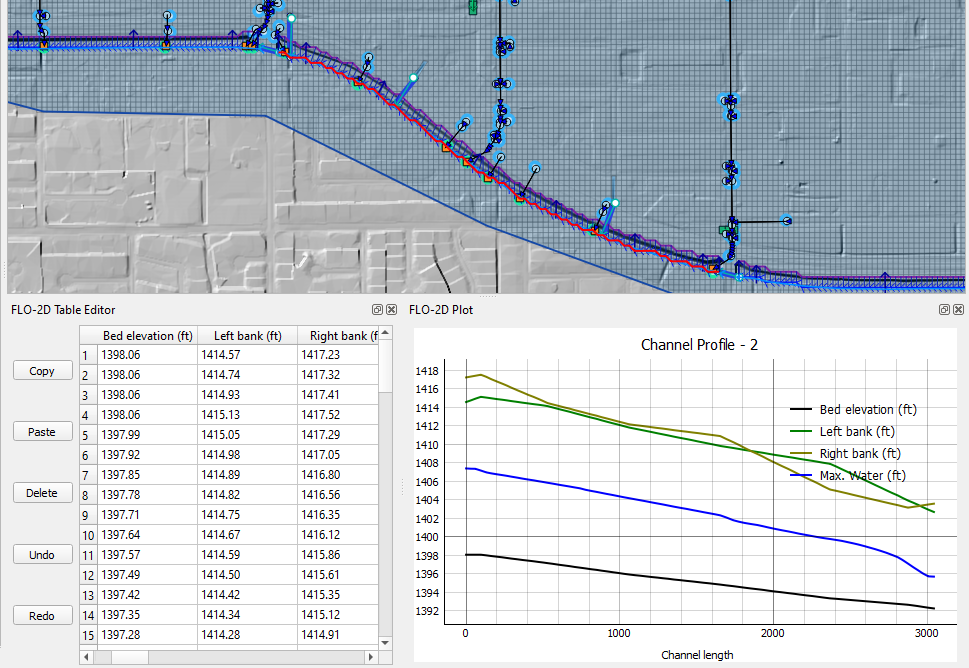
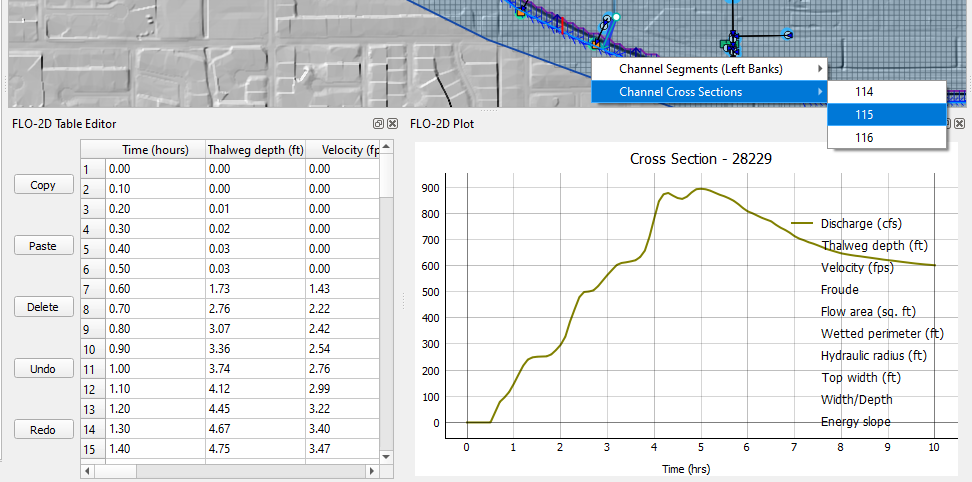
Click a cross section to plot the results reported in the HYCHAN.OUT file.
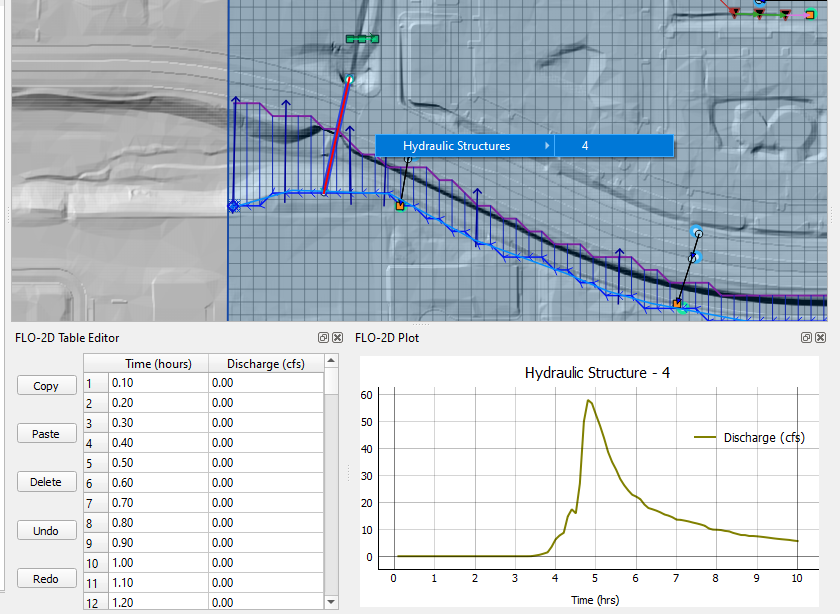
Hydraulic Structure Results
Click a structure to plot the time discharge plot.
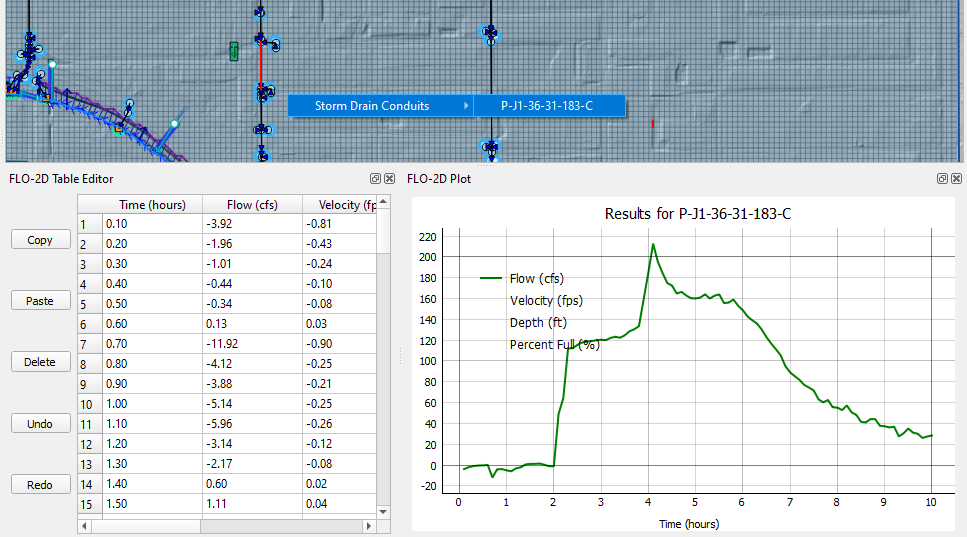
Storm Drain Results
Click any storm drain feature to load the results in the table and plotting panel.
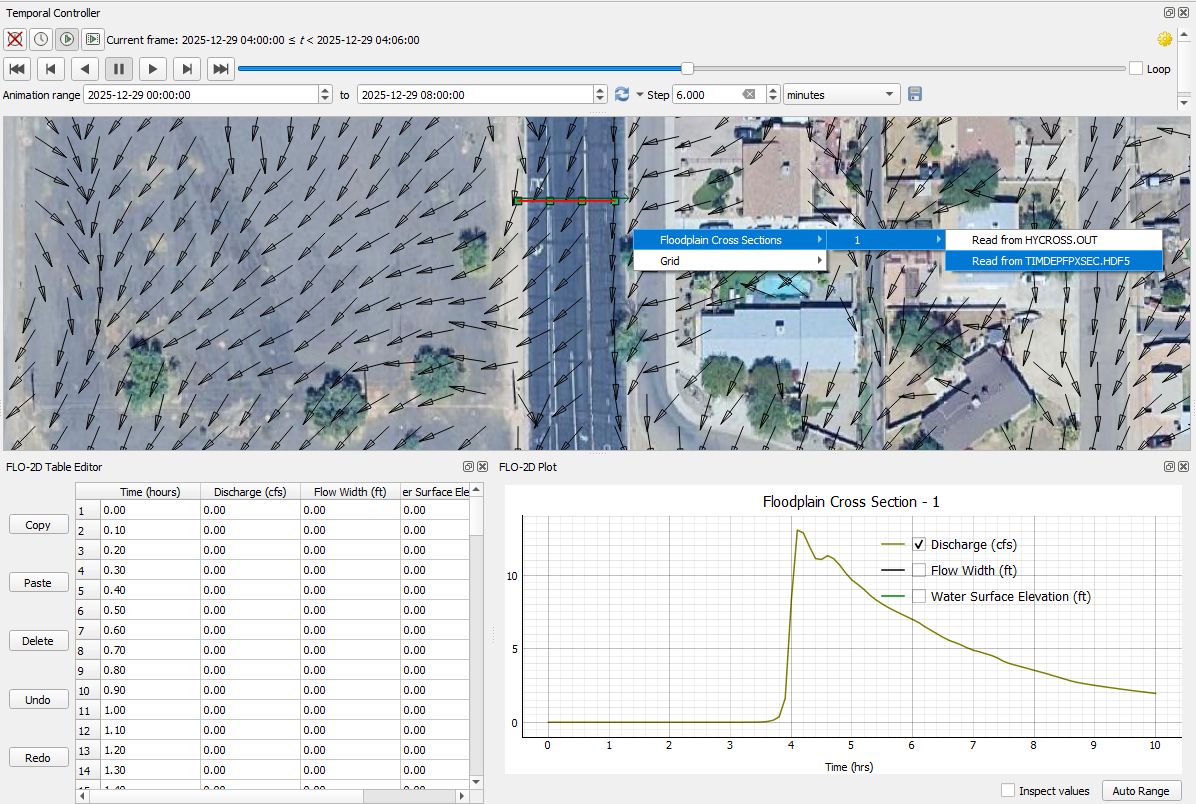
Floodplain Cross Section Results
Important
FLO-2D Pro Build 25 engine and FLO-2D Gila 2.0 plugin include a floodplain cross section tool that can read from any new cross section using a time dependent file called TIMDEPXSEC.HDF5. to set this file up, go here:
Click any floodplain cross section to load the results in the table and plotting panel. Note the new option Read from TIMDEPXSEC.HDF5 can be used for any new floodplain cross section. The old option Read from HYCROSS.OUT is used for predefined floodplain cross sections that were saved to FPXSEC.DAT.
Learn how to build floodplain cross sections for either case here: Create Floodplain Cross Sections
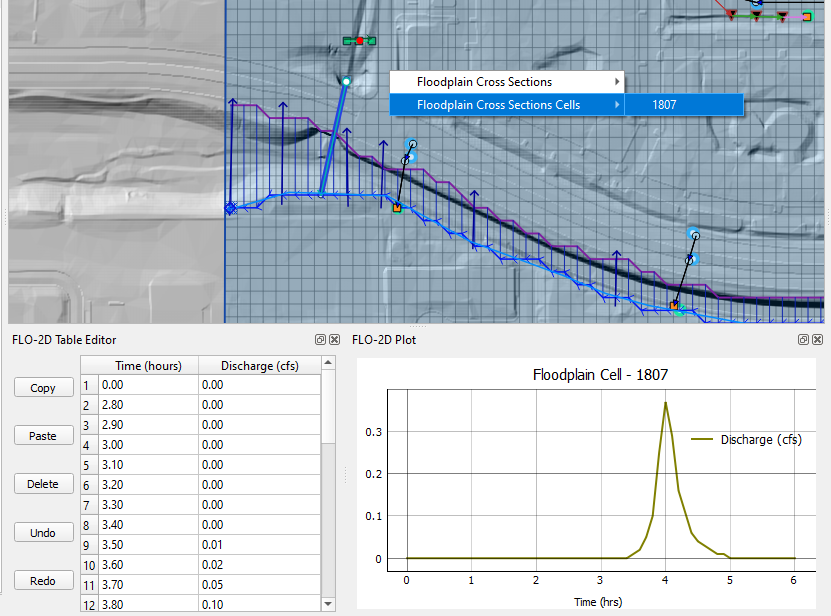
Click any floodplain cross section cell to load the results in the table and plotting panel.
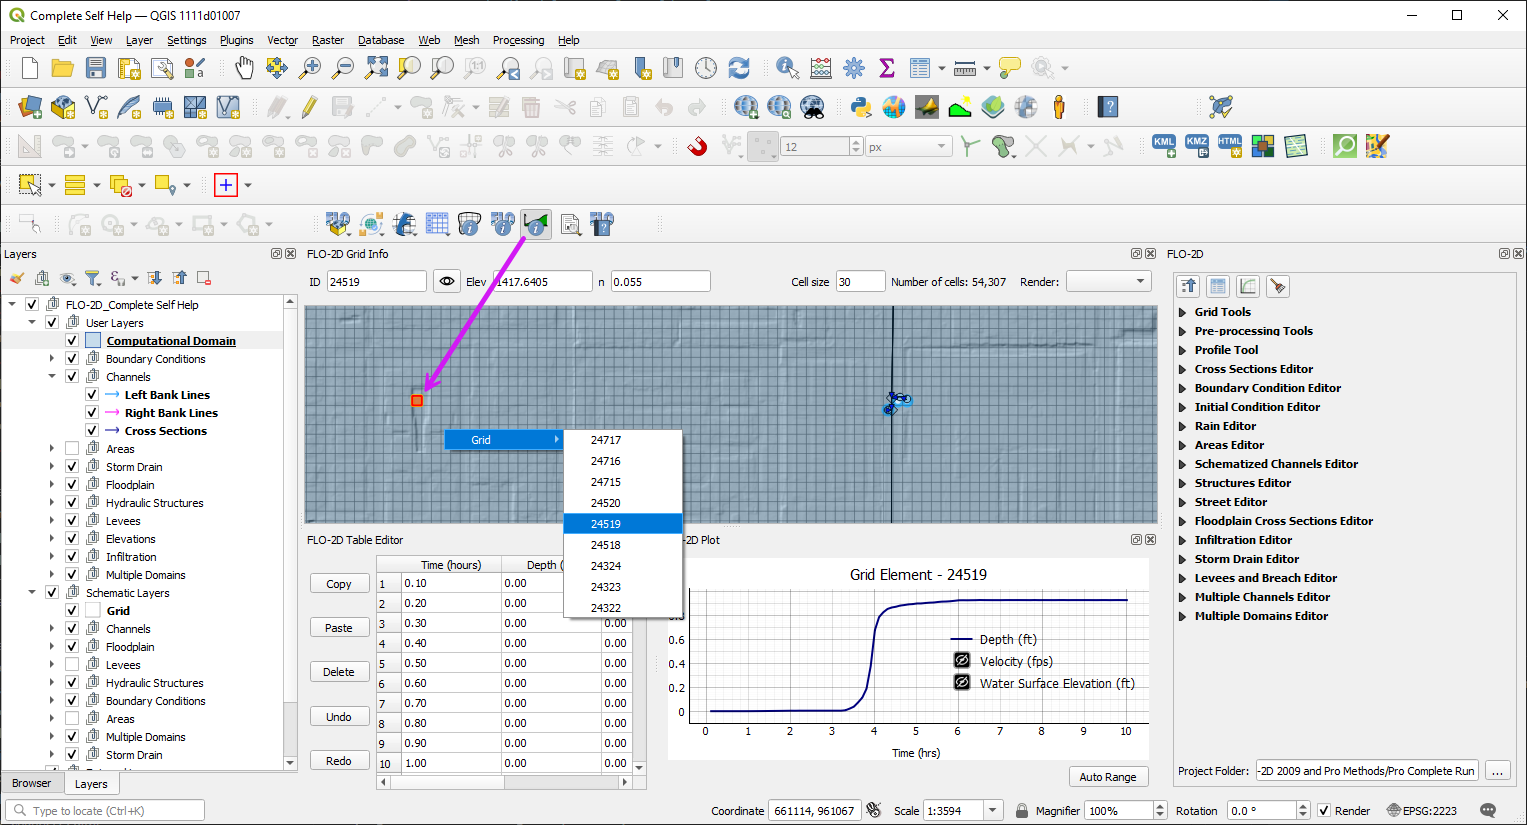
Grid Cell Results
Run a model with the time series results enabled to see the grid cell results.
Click any grid cell to load the results in the table and plotting panel.