Channels
This is an advanced channel lesson. It shows how to create a channel by digitizing left bank, right bank and cross section data. It also shows how to add a boundary control and culverts.
Note
It will be easier to view these videos on YouTube.
Set the video playback speed to 2x to complete the lessons faster.
The videos are more detailed whereas the text gives the minimum steps needed to complete the project.
Backup and Reload
This lesson introduces how to begin working with channels in FLO-2D. The first step is creating a project backup and preparing for channel data input.
Build Channel and Schematize
This lesson demonstrates how to create 3 channel segments using QGIS and the FLO-2D Plugin. The process involves digitizing channel banks and cross sections, followed by schematization and geometry validation.
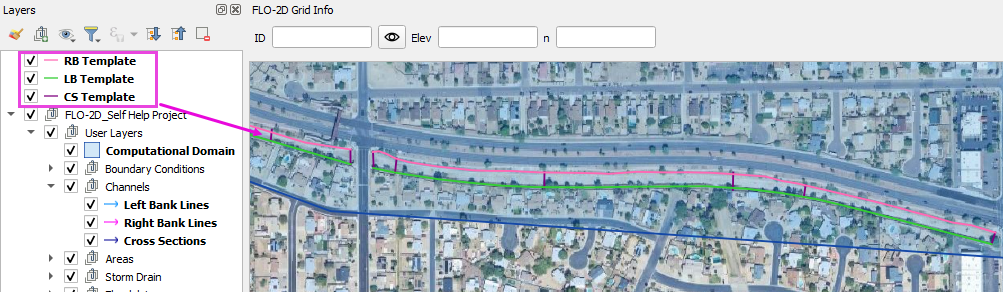
Step 1: Load Template Layers
Import template layers (LB Template, RB Template, CS Template).
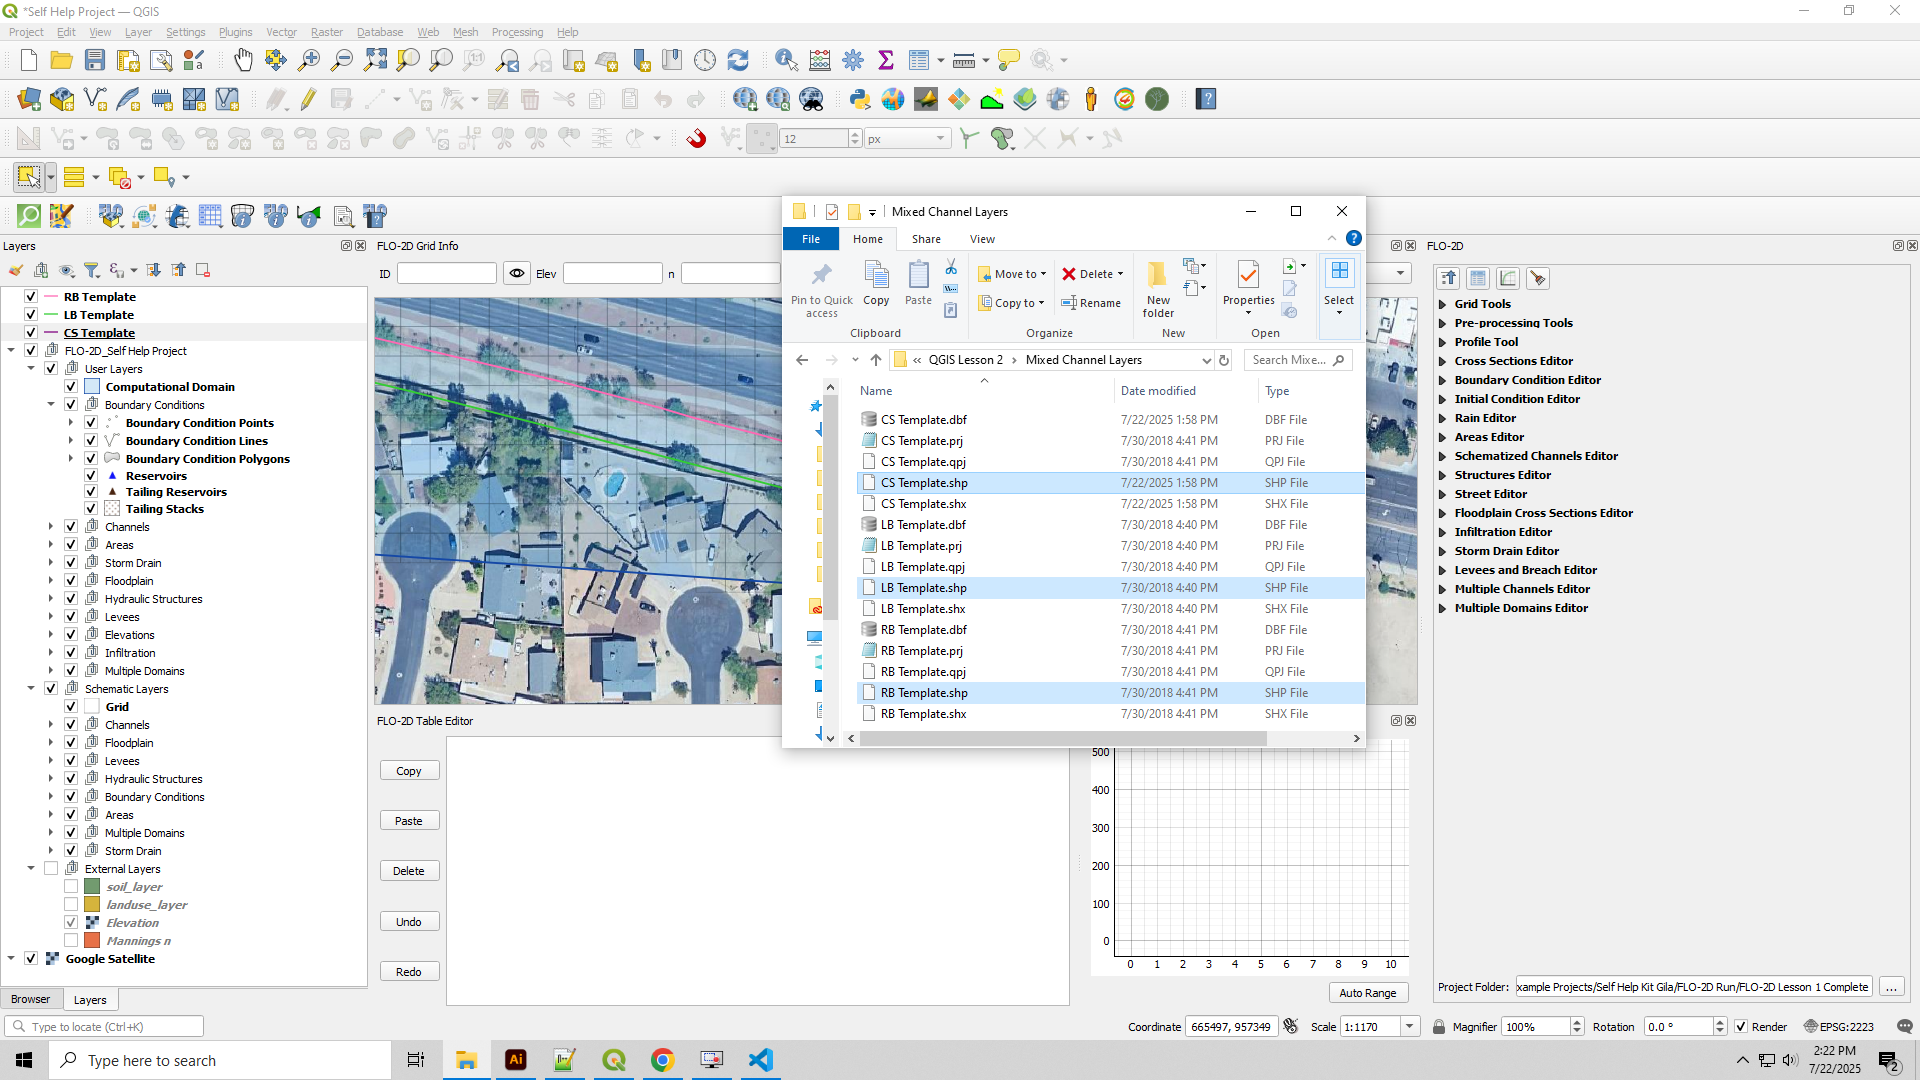
Use these layers as visual guides only.
Update colors for visibility:
LB Template: Lime Green 0.5 width
RB Template: Hot Pink 0.5 width
CS Template: Purple 0.5 width
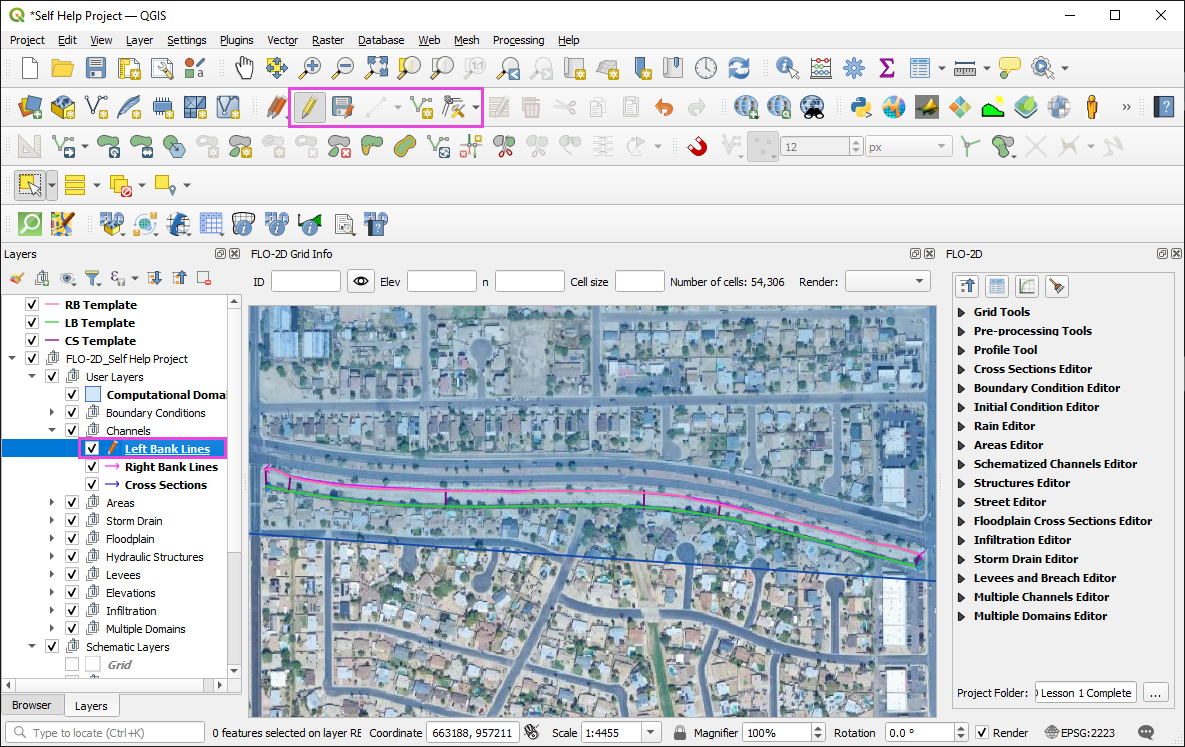
Step 2: Create Left Banks
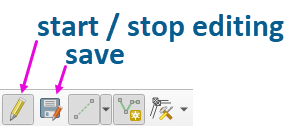
Activate editing on the left bank lines layer.
The left bank is left side of the channel when facing downstream.
Use “Add Line Feature” and set to Digitize with Segment.
Draw each left bank segment Upstream to Downstream.
Use the LB Template layer as a guide for alignment.
The following animation shows how to digitize the first left bank segment:
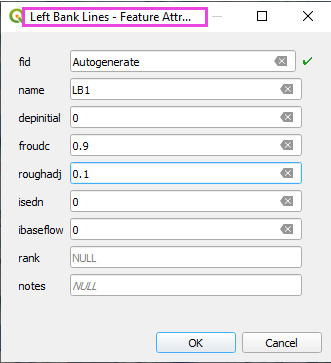
Fill the attributes as shown below or leave them blank and click OK. If you leave them blank, you can add them later in the Attribute Table.
Tip
Use satellite imagery and elevation hillshade to align the banks. Use consistent start and end locations across segments.
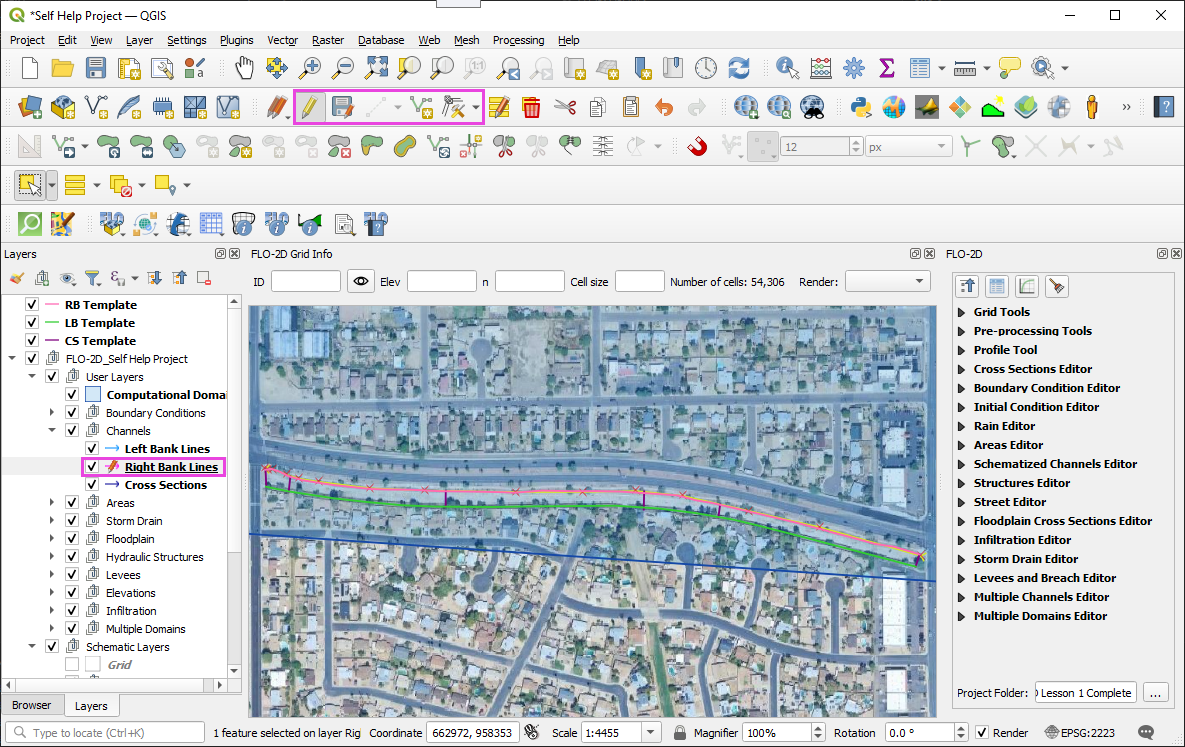
Step 3: Create Right Banks
Activate editing on the Right Bank Lines layer.
The right bank is right side of the channel when facing downstream.
Use “Add Line Feature” and set to Digitize with Segment.
Draw each right bank segment Upstream to Downstream.
Use the RB Template as a guide for alignment.
The following animation shows how to digitize the first right bank segment:
Tip
Use satellite imagery and elevation hillshade to align the banks. Use consistent start and end locations across segments.
Keep the right banks close to the fence line but away from the street.
Step 4: Save Bank Lines
Save the bank line layers and stop editing.
Step 5: Cross Section Rules
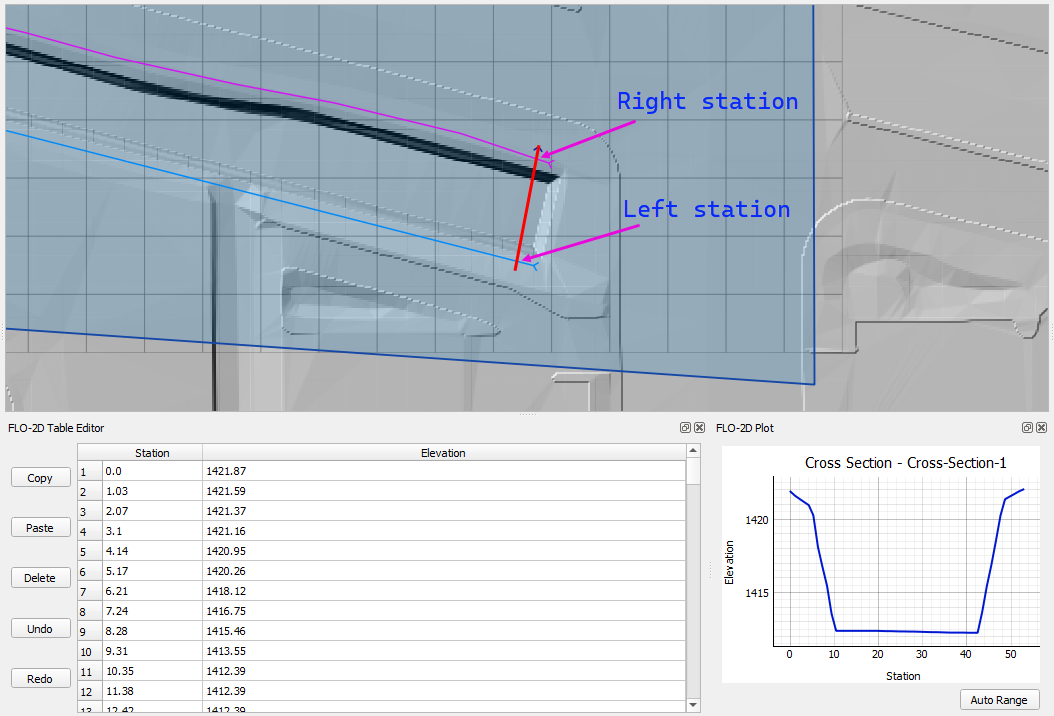
The first cross section in each channel segment must have its end points located within the same grid elements as the corresponding left and right bank lines. The following image small circles around the end points and they are located within the same grid elements as the left and right bank lines.
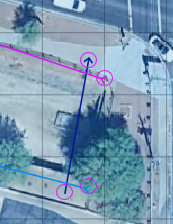
The cross section must cross the left and right bank lines.
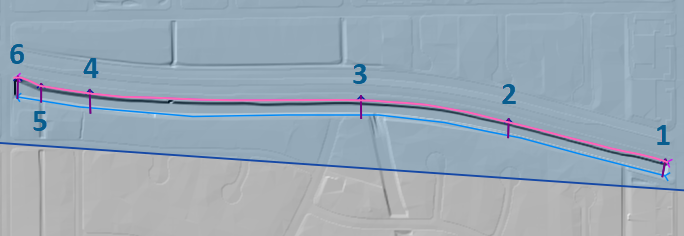
Digitize the cross sections from upstream to downstream.
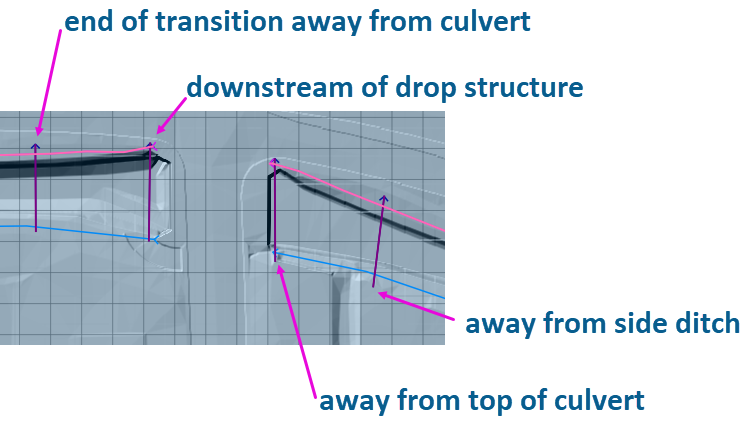
Place the cross section where the DEM elevation is representative of the channel.
Try to represent the channel transition up to and away from culverts or other structures.
Do not place two cross sections in a single grid element.
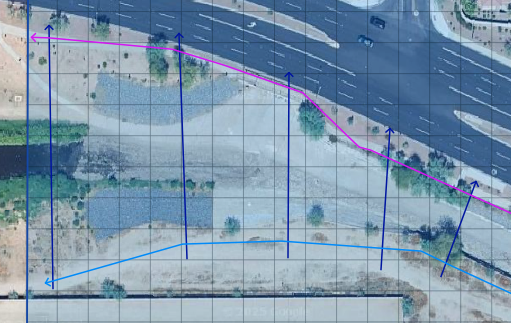
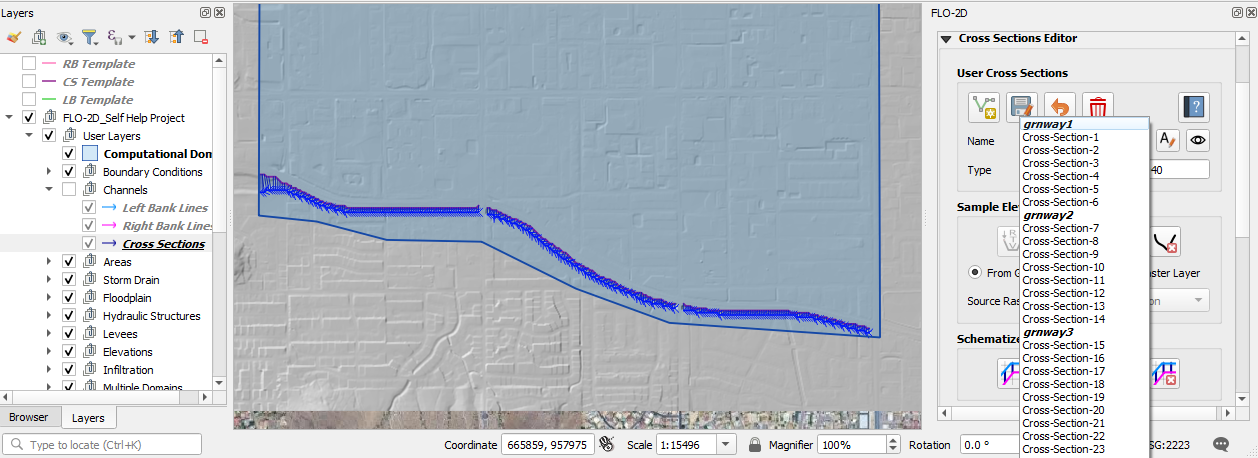
Step 6: Digitize Cross Sections
Use the CS Template as a guide for alignment.
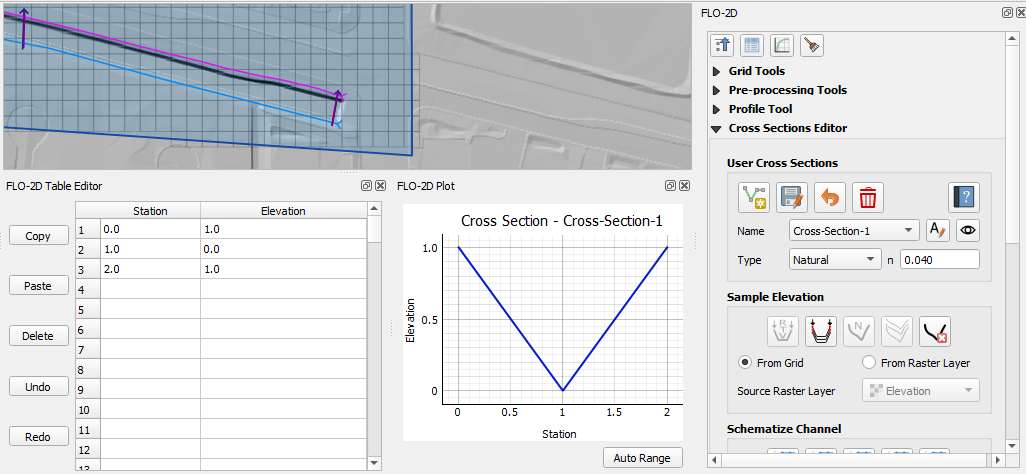
Use the Cross Section Editor.
Click Add Line Feature button.
Start digitizing cross sections.
When finished, click the Save button.
Use the enter key or click OK to close the dialog. It is faster to use the enter key. It is OK to modify the n value and name fields. but not necessary at this point.
Use the arrow keys to quickly pan to the next cross section.
Note that the gif only shows the first 3 cross sections being digitized.
Natural (“N”) type cross sections are given temporary geometry that will be replaced by sampling elevation.
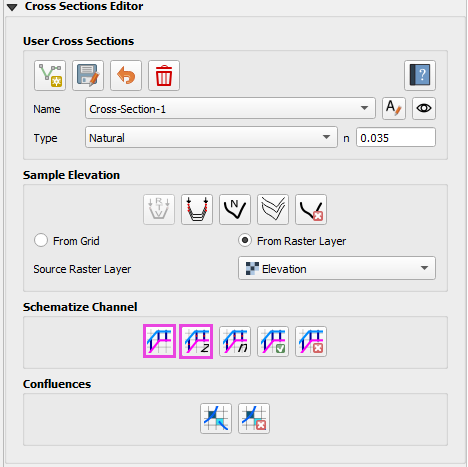
Step 7: Save and Schematize
Use the Cross Section Save Button (not the QGIS save button) to trigger correct processing.
Cross sections will initially have placeholder elevation data.
Click Schematize Channel Button to create the schema layers and validate the channel placement.
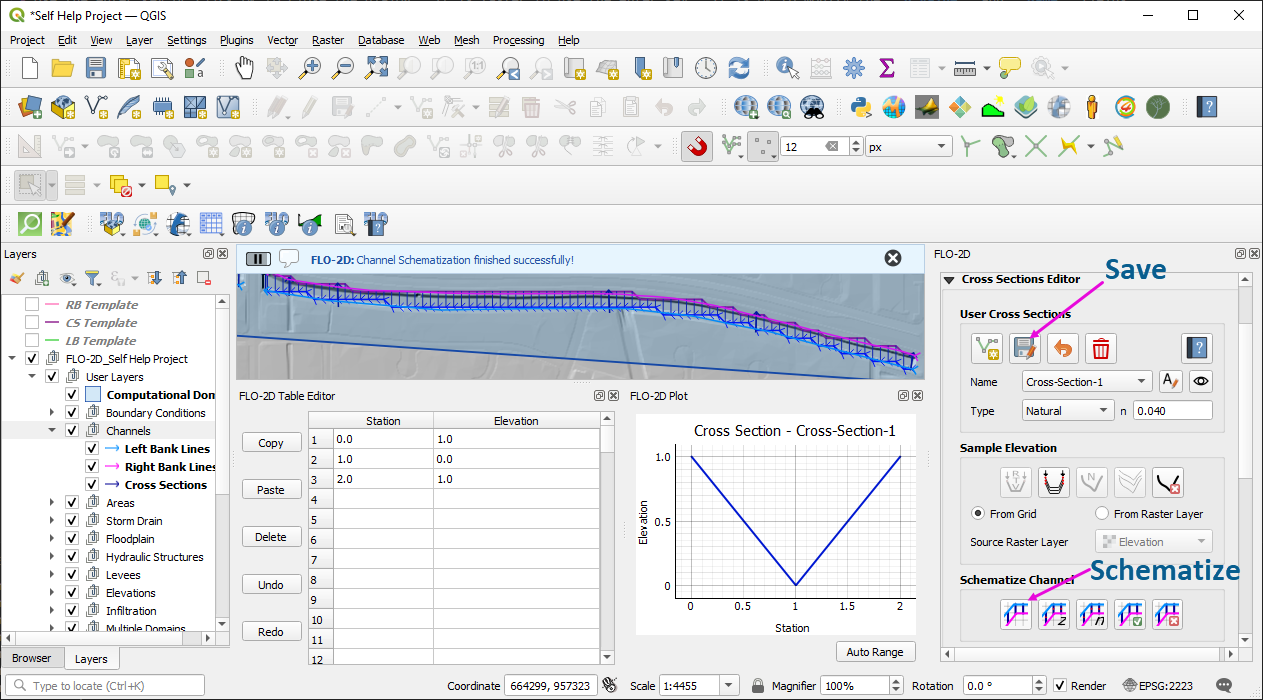
Errors such as “bank and cross section not in same grid cell” will be reported.
Note
This error was intentionally created to show the error message. Watch the video to see how to fix it.
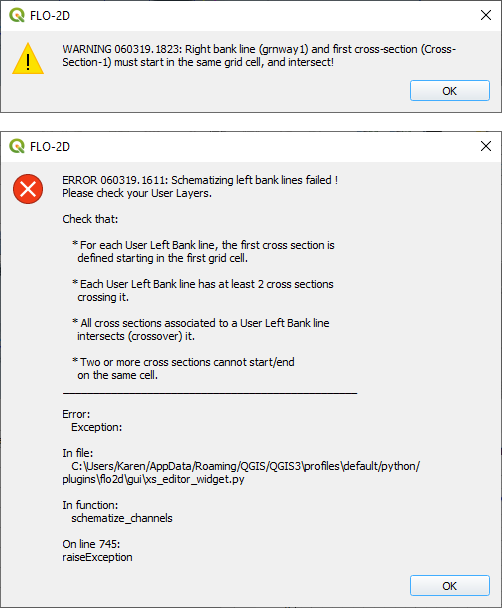
If errors occur:
Adjust the cross section position to ensure it crosses both banks.
Ensure the first cross section endpoints are within the same grid elements as the bank lines.
Use the Vertex Editor to modify cross section alignment.
After resolving errors, click Schematize Channel again to update the schema layers.
Schematized cross sections are grouped by channel segments.
Sample Elevation and Schematize
This lesson walks through how to sample and refine elevation data for FLO-2D cross sections after schematizing channel geometry.
Step 1: Sample Elevation Data
Open the cross section editor.
Select Sample All to gather elevation data from the grid DEM.
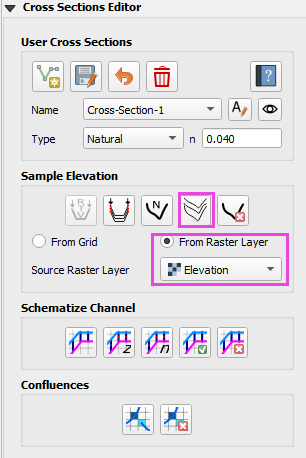
Elevation is sampled from the point where the cross section crosses the left bank line to the right bank line of each cross section.
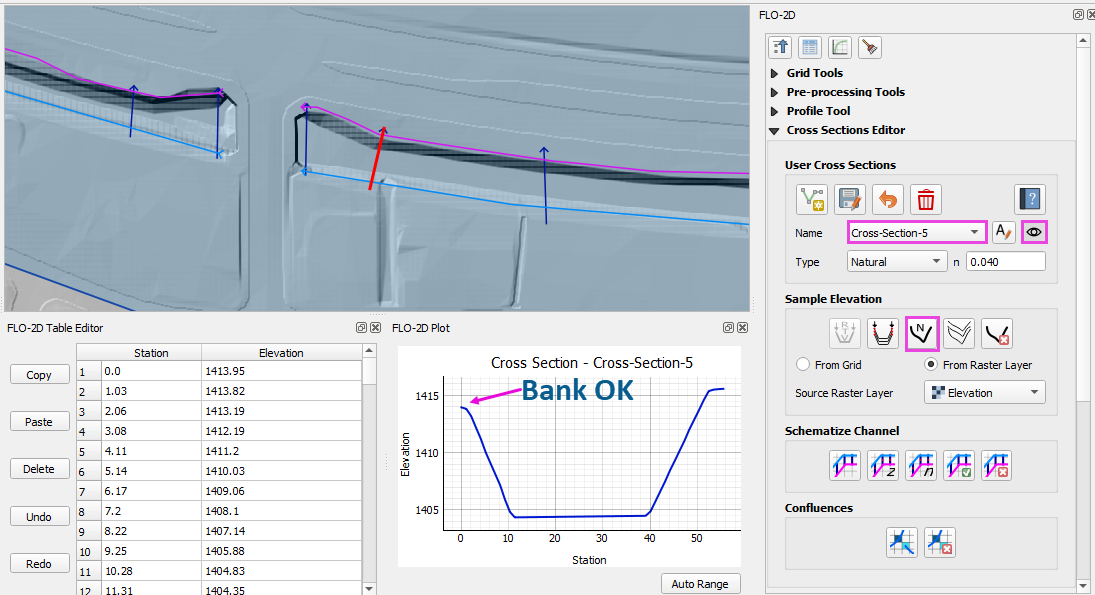
Step 2: Review and Repair Bad Cross Section Profiles
Use the scroll wheel to cycle through each profile.
Look for elevation anomalies or errors (jagged shapes, incorrect bank elevation, no banks).
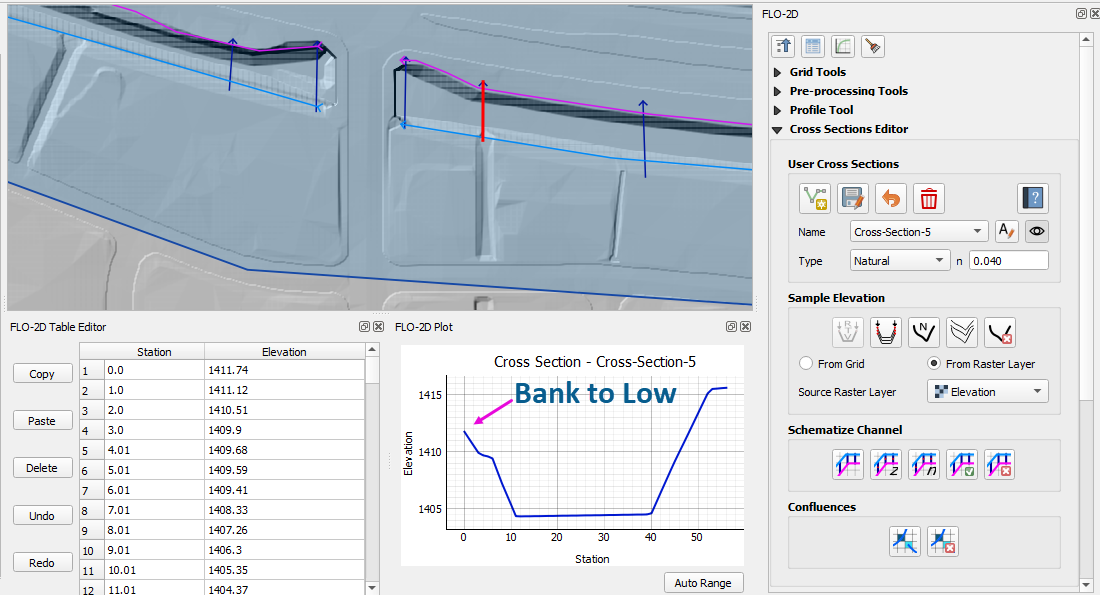
For bad cross section profiles, try:
Adjust the vertices of the cross section, left bank, or right bank layers using the Vertex Tool
Drag vertex points slightly to avoid bad samples (e.g., near culverts or transitions).
Click Sample Single to resample after adjustment.
Note
For a more detailed example, watch the video.
Bank Align and Interpolate
Learn how to refine the left and right bank channel alignments and perform a test simulation to validate your model setup.
Note
These steps might not follow the video exactly. These steps are the minimum needed to complete the task.
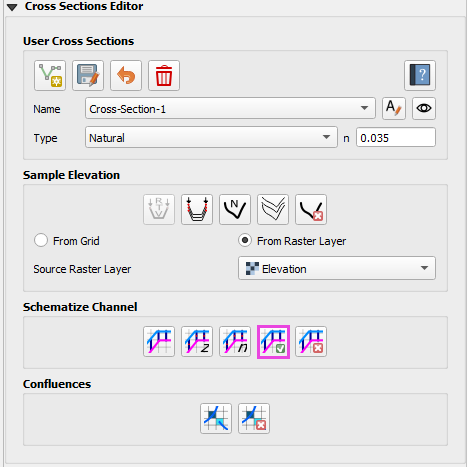
Step 1: Schematize and Interpolate
Click Schematize Channel to commit updated geometry.
Click the Interpolate Channel tool to interpolate schema cross sections which are between the user cross sections.
If an interpolation error loads, check the project path using the FLO-2D Settings dialog.
Step 2: Use the Geometry Checker
After interpolation, click Check Channel Geometry:
It will verify minimum spacing and floodplain surface area.
Click error messages to locate problematic cross sections or elements.
Adjust vertex positions as needed to resolve errors.
Re-schematize and interpolate again.
Note
See the video for a detailed example.
Step 3: Review Bank Alignment
Use the Vertex Tool to adjust left and right bank lines.
Step 4: Final Save and Verification
Save both the bank lines and cross section layers.
Verify that your cross sections still have good elevation data.
Perform a final schematize, interpolate, and geometry check.
Add a Boundary Control
In this lesson, assign inflow and outflow boundary conditions to the FLO-2D channel model using both steady and time-series hydrographs.
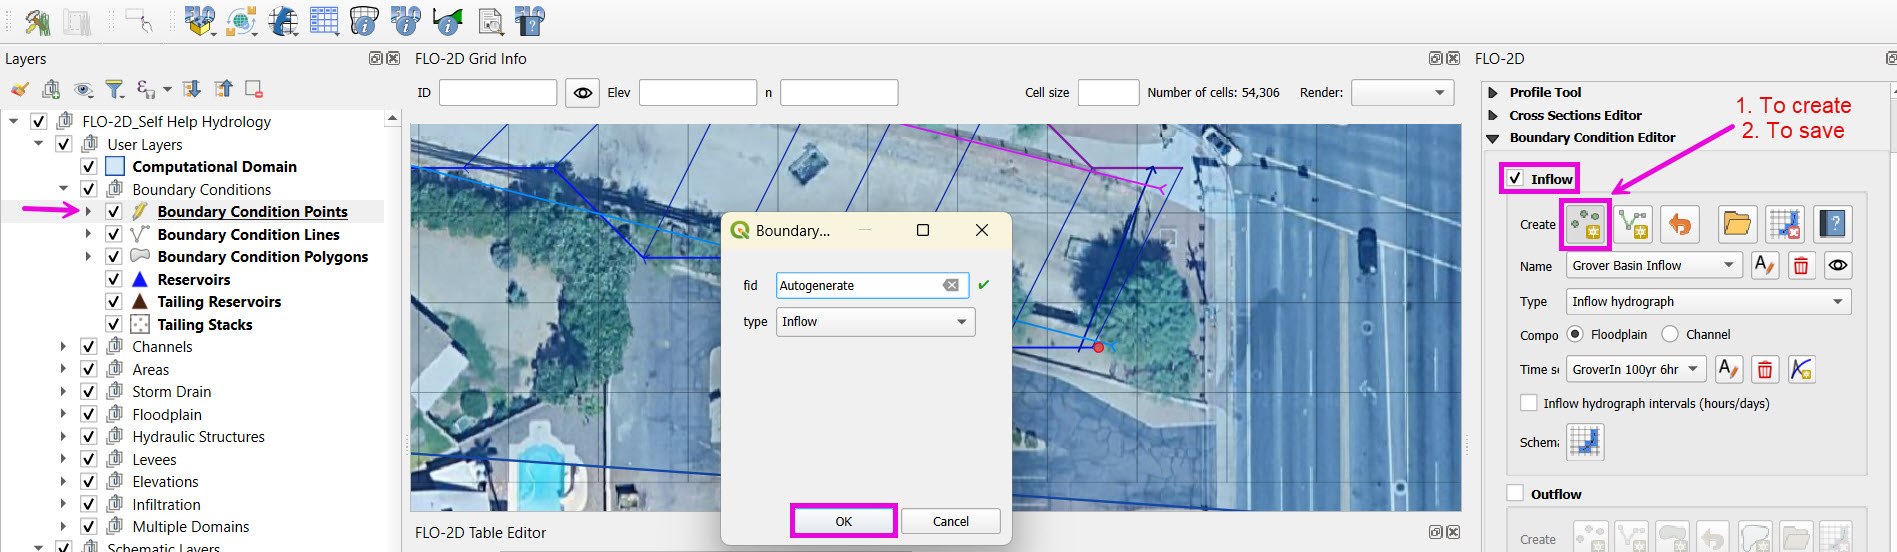
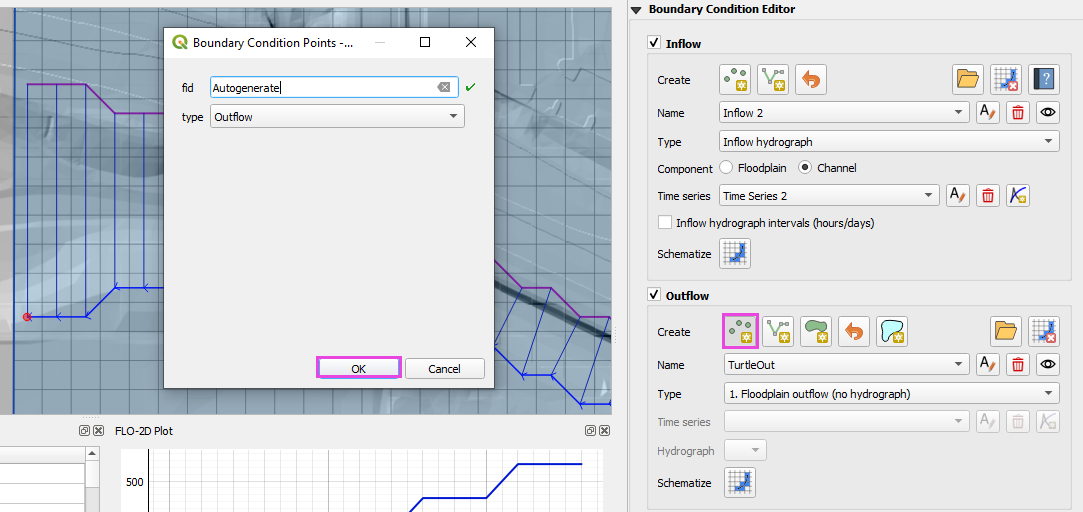
Step 1: Create Upstream Inflow Point
Open the Boundary Editor and click Add Point.
Select the upstream grid element at the head of your channel.
Click OK, then click the new boundary marker again to save.
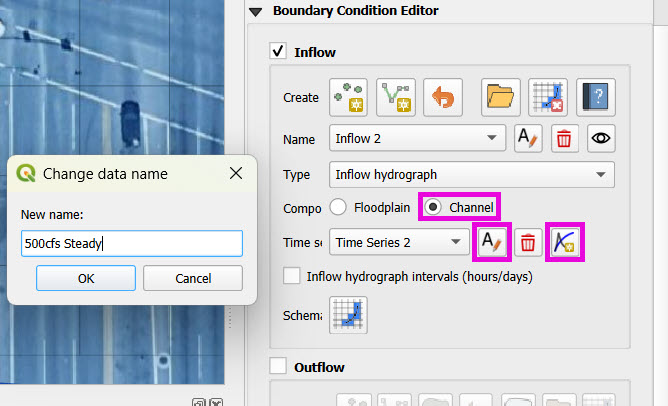
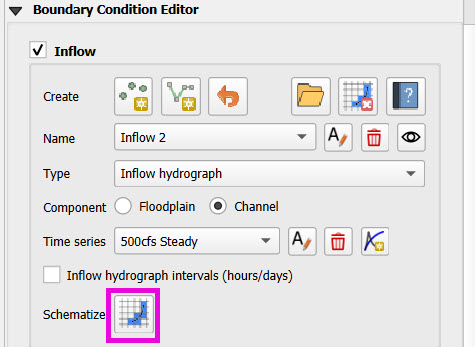
Step 2: Add Inflow Hydrograph
Set the boundary type to Channel.
Choose “Add Inflow Time Series”.
There are several options for hydrographs but here are two examples:
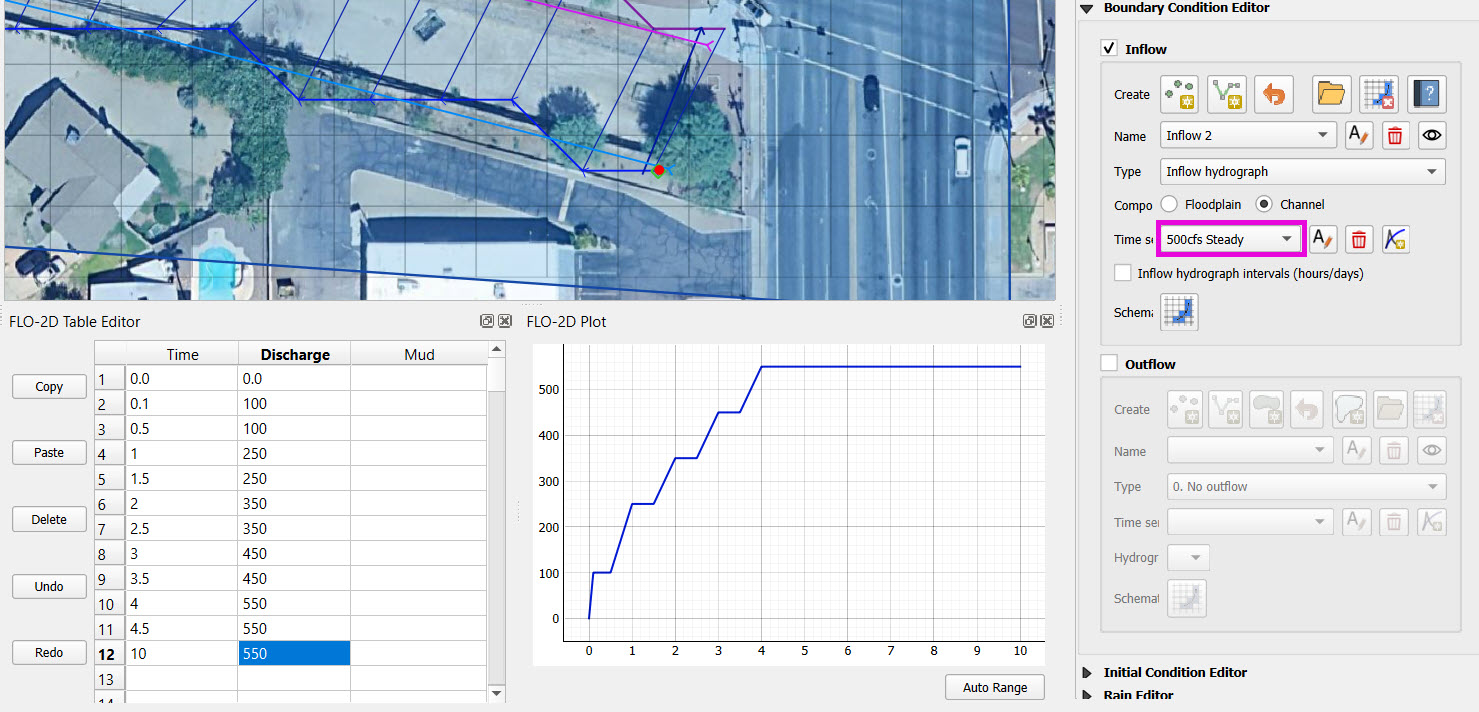
Steady Flow or Stepped Hydrograph
Create a hydrograph with incremental CFS values (e.g., 100 → 250 → 350 → 550).
Sample time steps at 0.5-hr intervals until 10 hours.
Imported Hydrograph
Copy a 6-hour inflow from your project folder (e.g.,
lesson2).Paste values directly into the hydrograph table.
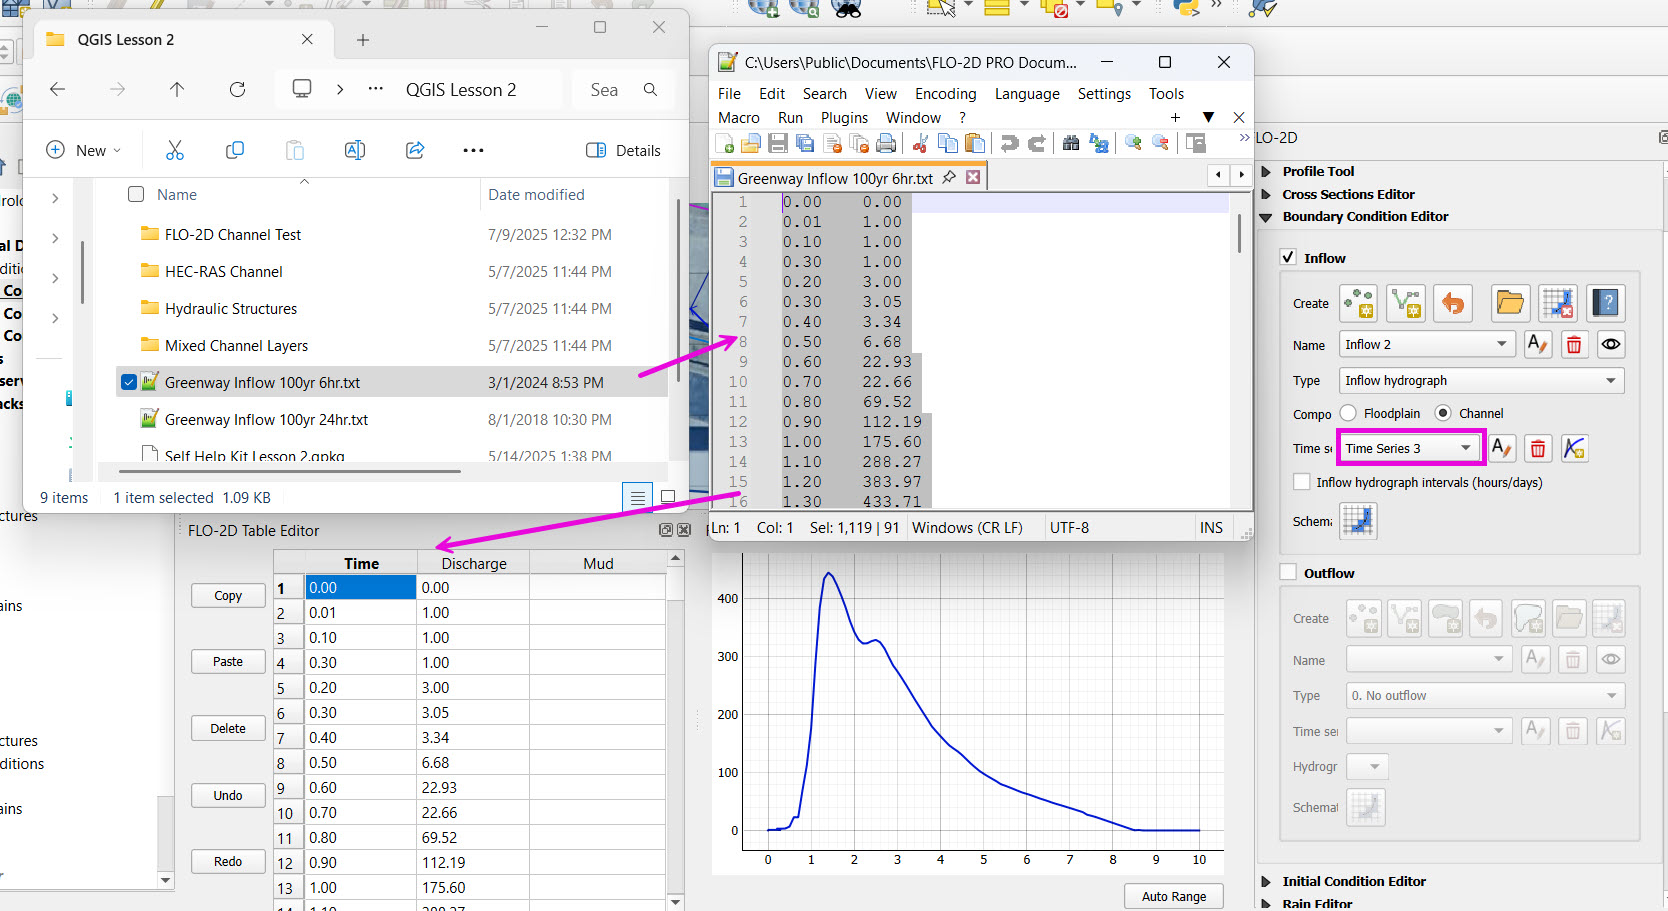
Rename “Time Series 3” to “GrnwayIn 100yr 6hr”
Finish the upstream inflow by clicking the schematize button.
Tip
Swap between hydrographs quickly by selecting a different record and schematizing.
Step 3: Create Downstream Outflow Point
Click the Boundary Editor point button on the outflow widget.
Click the left bank element of the last channel element.
This will be the normal outflow condition for the cross section.
Click to confirm, then click the marker again to save.
Name the boundary (e.g.,
GrnwayOut).
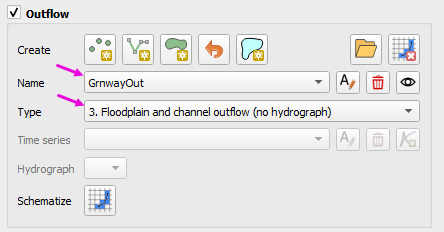
Set type to Floodplain and Channel Outflow.
No hydrograph is required.
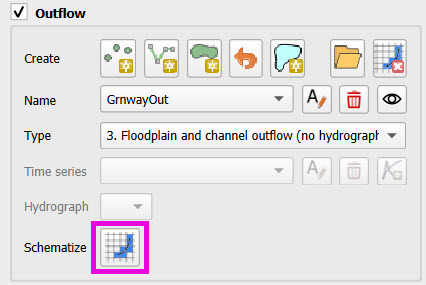
Click Schematize to generate boundary files.
Add Culverts
This lesson covers how to define and integrate culvert structures into a FLO-2D channel using rating tables.
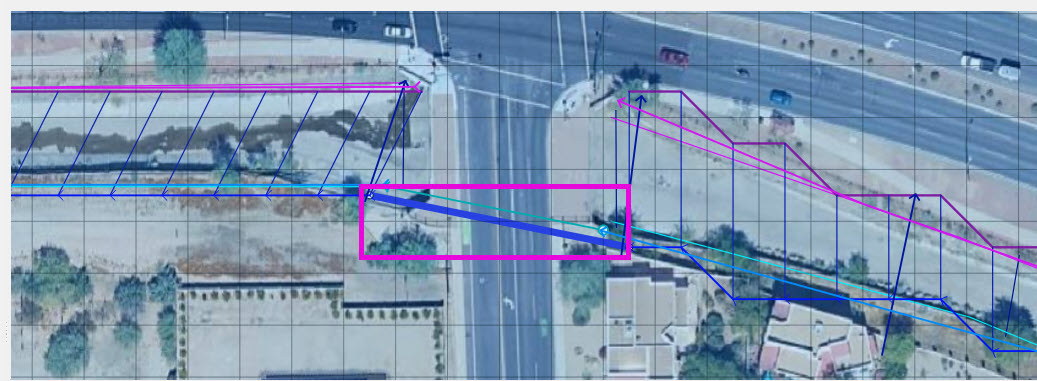
Step 1: Identify Culvert Locations
Switch to the Structure Editor and click Add Structure.
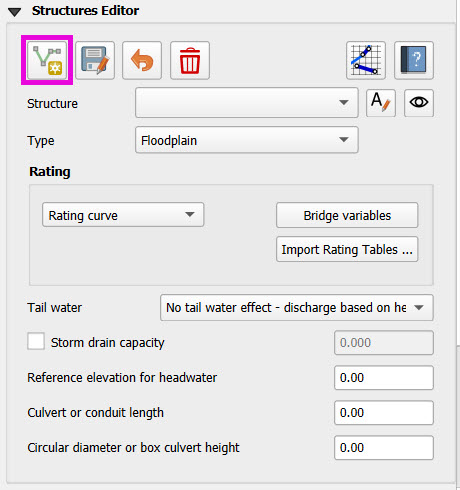
Draw each structure from the left bank of the upstream channel to the left bank of the downstream channel.
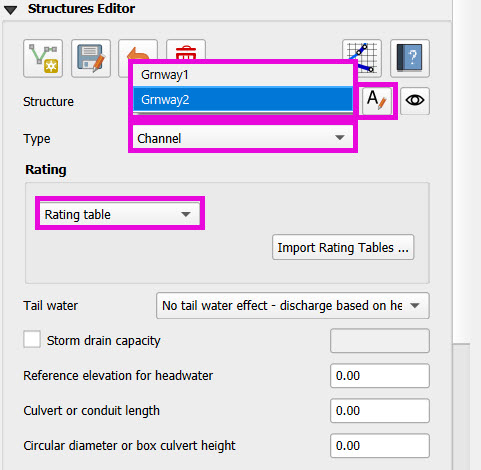
Step 2: Define Structure Properties
Click Save after drawing all structures.
Name each structure (
Grnway1,Grnway2).Do not use spaces in names.
Set:
Type: Channel to Channel
Rating: Rating Table
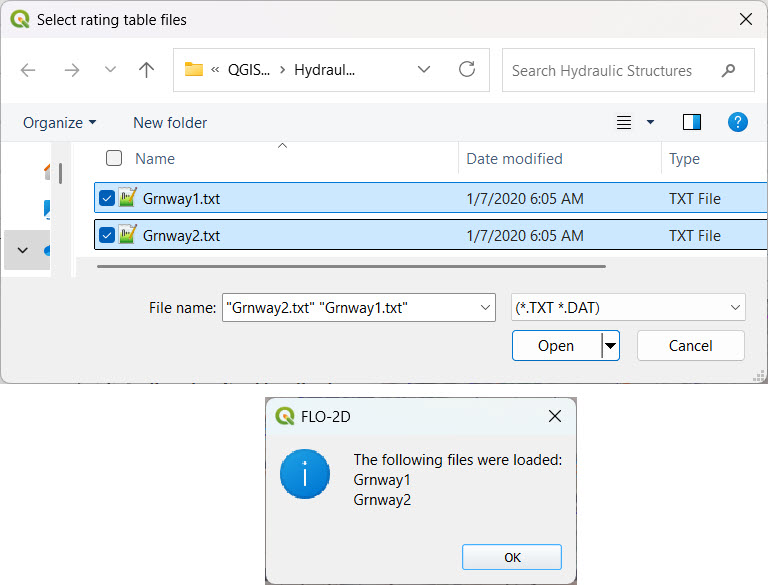
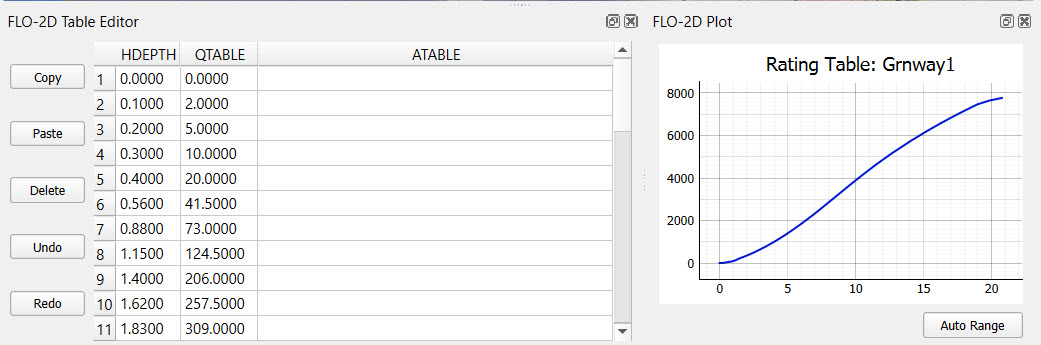
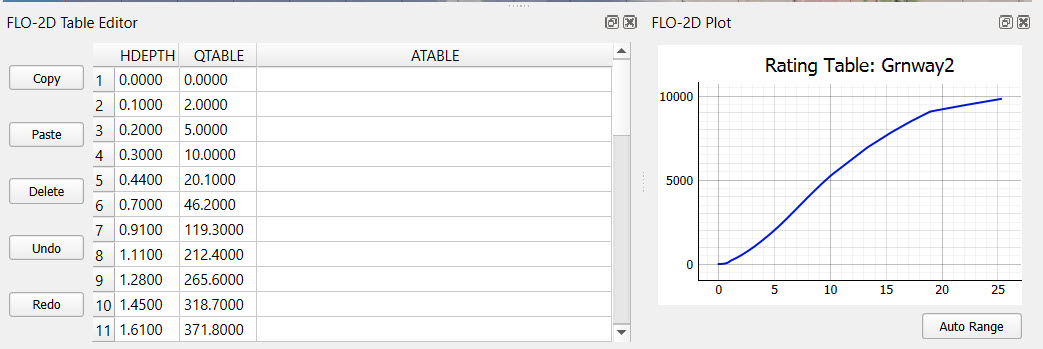
Step 3: Import Rating Tables
Use the Import Rating Table tool.
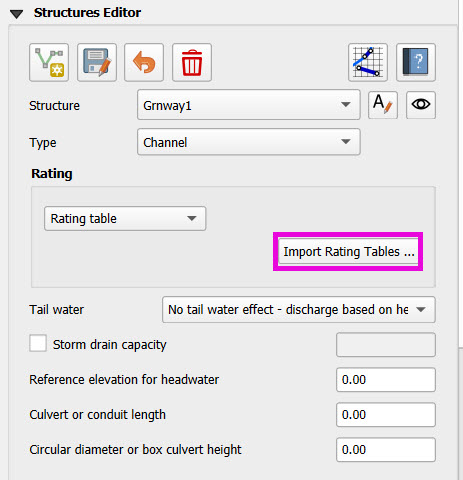
Ensure filenames match the structure names exactly (e.g.,
Grnway1.txt).
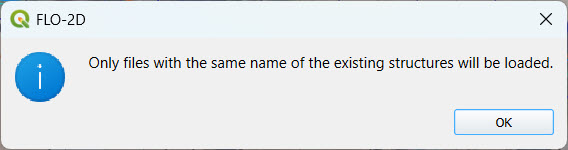
Loaded data should now populate the structure’s table.
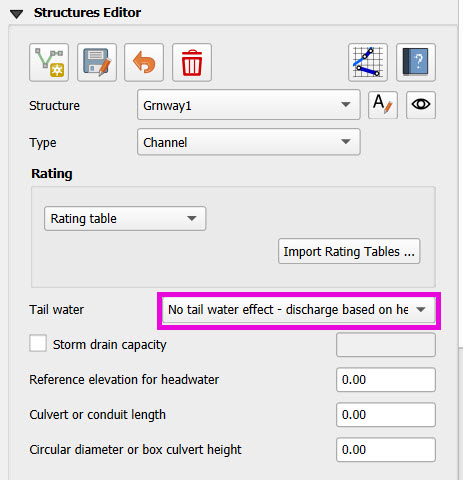
Step 4: Tailwater Controls
Options:
No Tailwater Control: Only headwater affects flow (e.g., flap gates).
Submergence Applied: Tailwater reduces discharge, but no reverse flow.
Submergence with Reverse Flow: Allows flow to reverse under high tailwater.
Set to No Tailwater Control for this basic model (warnings may occur).
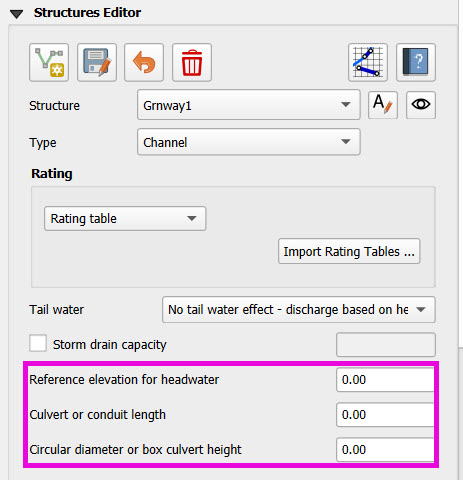
Step 5: Optional Parameters
Head Reference Elevation: Only used if a weir controls flow.
Length and Diameter: Required only if using Generalized Equation or Long Culverts in excess of 500 ft,
Step 6: Schematize and Save
Click Schematize to convert user-drawn structures to FLO-2D grid aligned features.
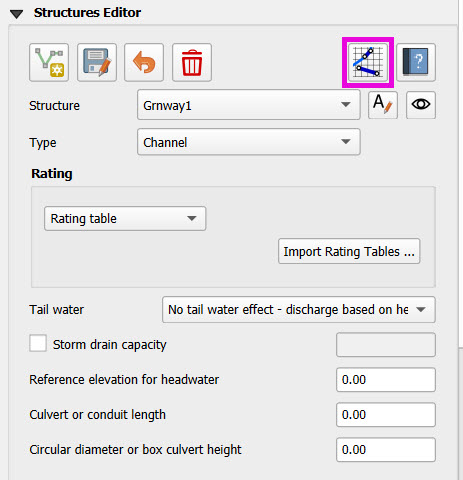
Schema lines (blue) are snapped to grid centers.
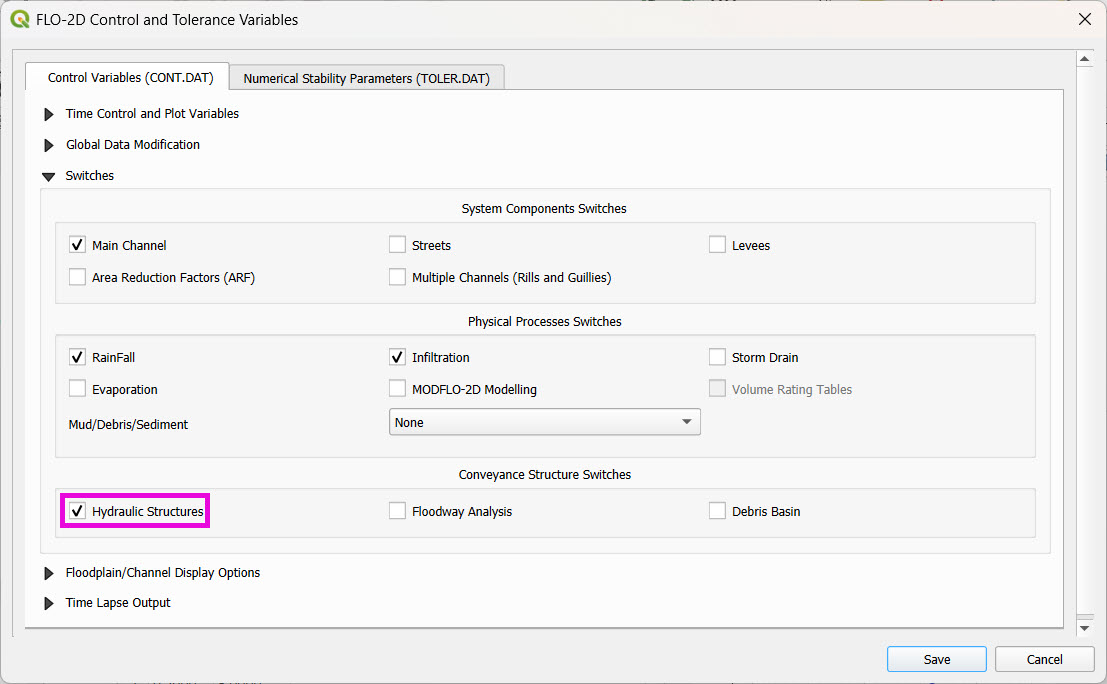
Enable Structure Switch in Control Parameters, then Save.
The switch may be automatically enabled when the Schematize button is clicked.
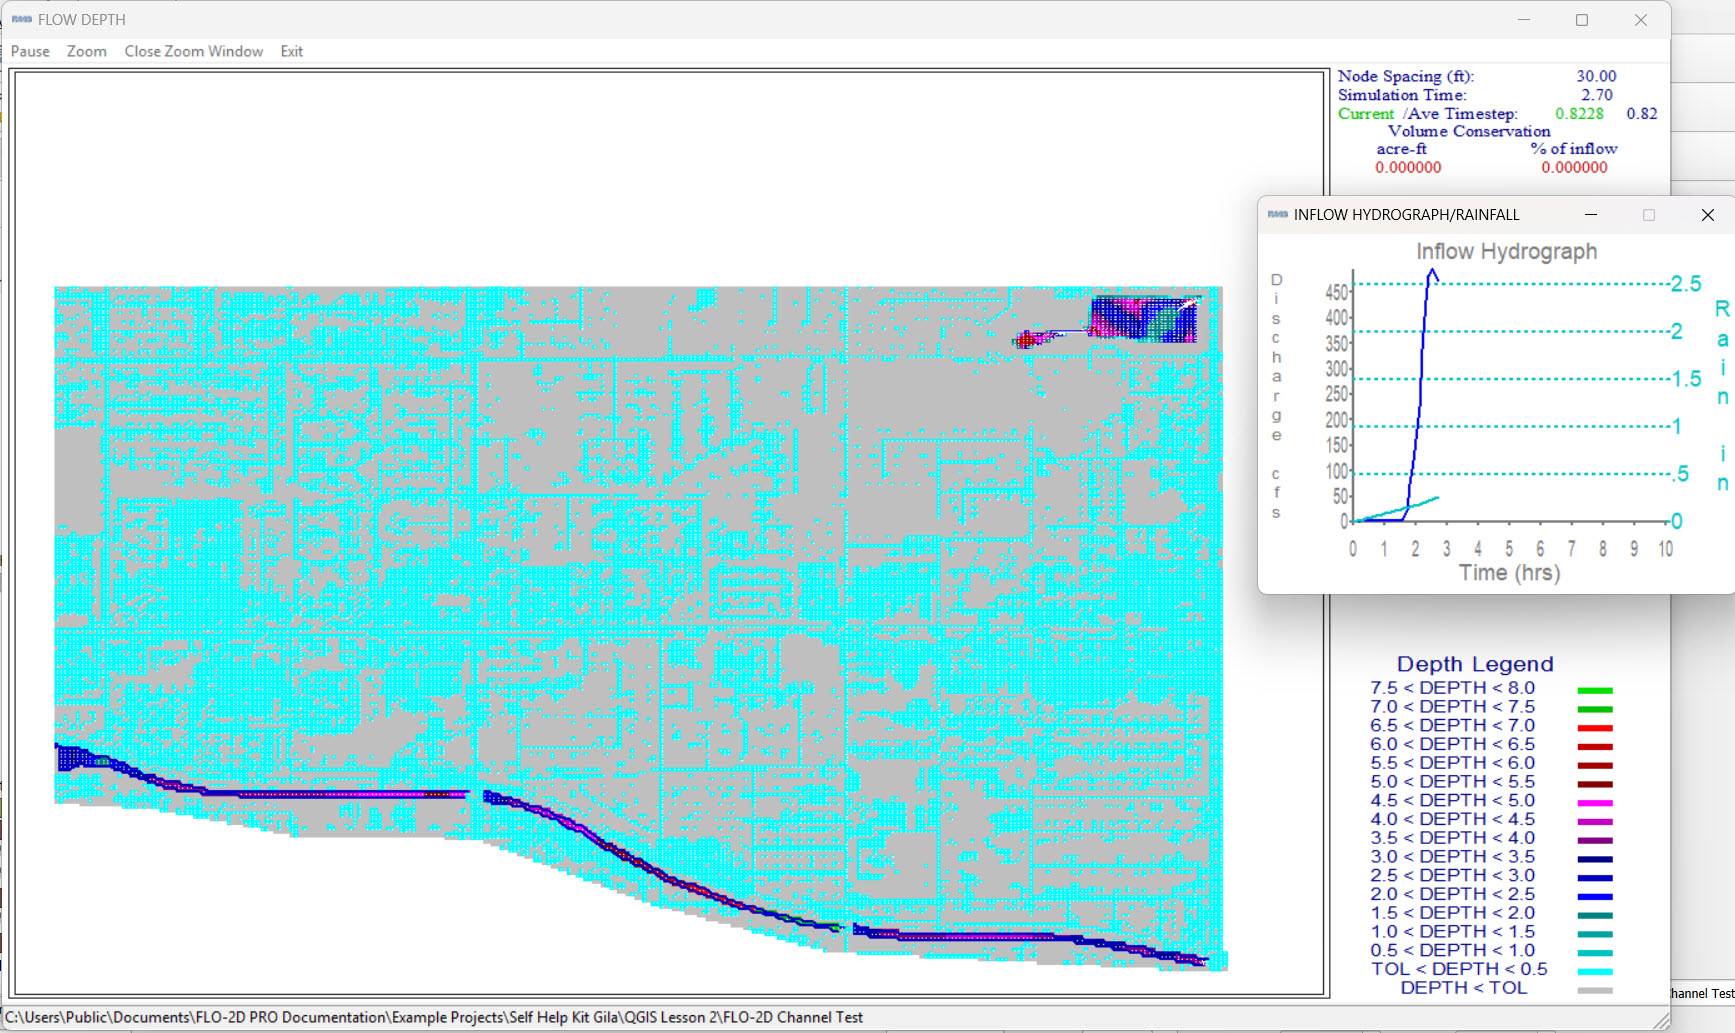
Step 7: Run a Test Simulation
Run a Quick Run to verify the channel and structures.
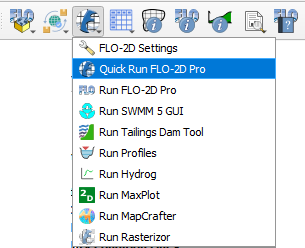
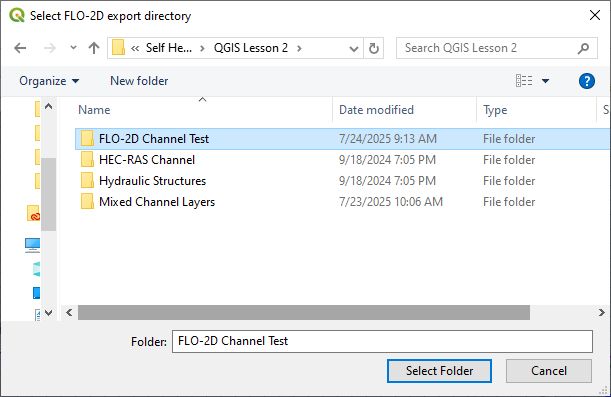
Create a Run Folder to start export the data files into.
Click OK twice to start the simulation.
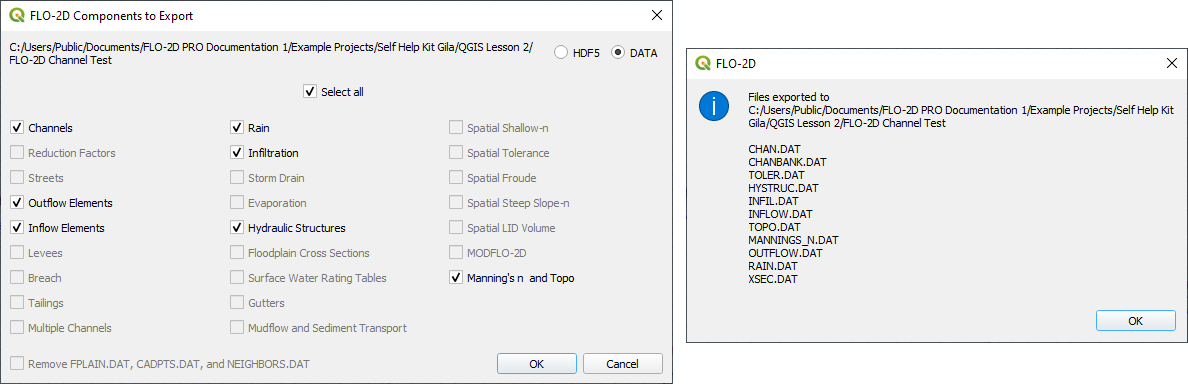
The run will take a few minutes to complete.
Note
If an error occurs, check the ERROR.CHK text file for details. The videos show more details on how to fix common errors.
Channel Summary and Results
This video shows how to view simulation outputs, map flood depths and elevations, and evaluate hydraulic structure performance in FLO-2D.