
Sample Roughness#
Overview#
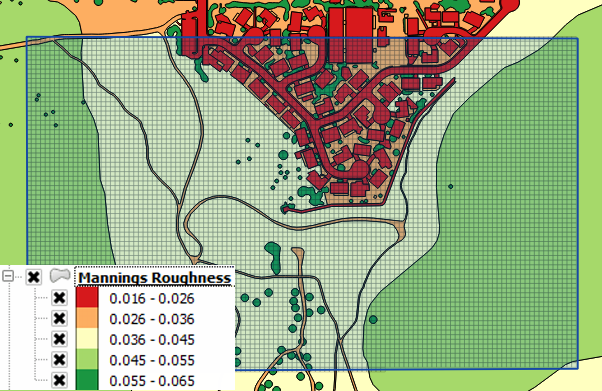
In this task, the spatially variable manning’s roughness is calculated from a polygon shapefile. The polygons represent roughness associated with different LandUse categories such as building, street, grass, desert brush and many others.
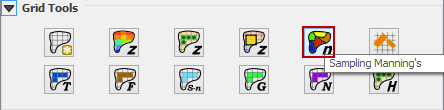
The Plugin has 4 methods for calculating roughness. Use the Sampling Manning’s tool to access the calculator.
Click the Sample Manning’s button from polygon layers.
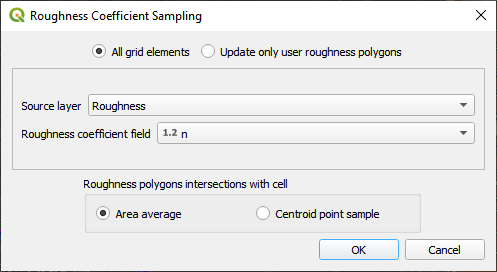
This layer requires a polygon shapefile with roughness data or digitized data assigned to the Roughness User Layer. The tool will calculate Manning’s roughness values with three different processes.
Roughness Polygon Intersection#
To calculate a weighted average of manning’s polygons to grid element polygons, use the Source Layer and Intersect cell rectangle option.
Roughness Point Sample#
To calculate a point sample from the centroid of the grid element on the manning’s polygons, use the Source Layer and Intersect cell centroid option.

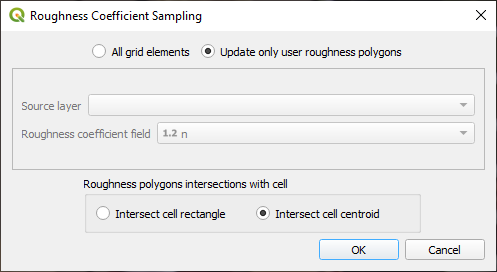
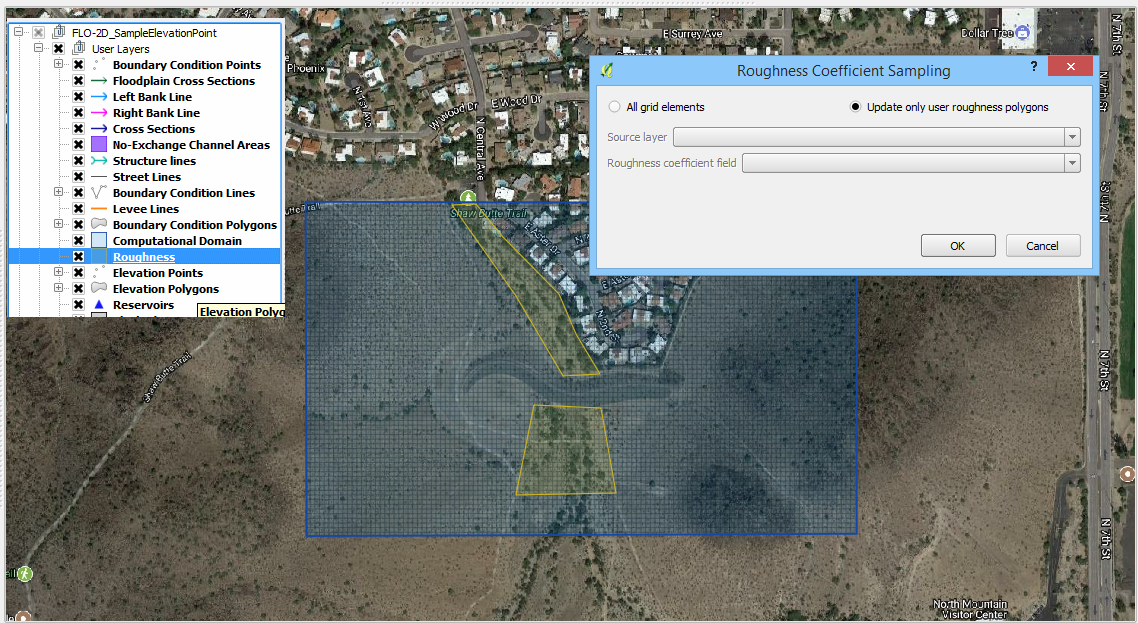
Roughness Update#
This option will only update cells whose centroid lies within the Roughness Layer polygons and leave all other values as is.
Once the sample is complete, the following window will appear. Click OK to close the window.
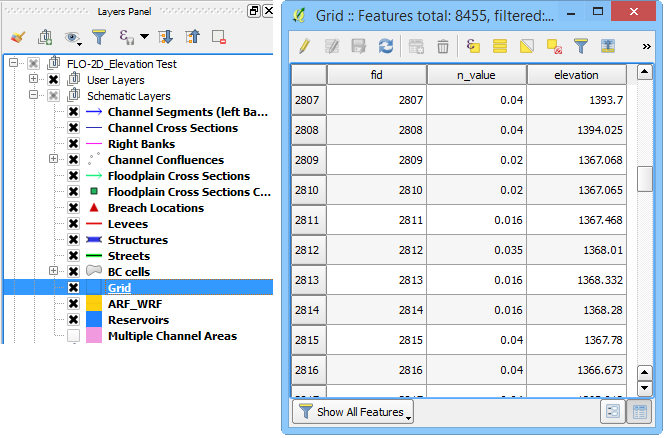
The roughness values are assigned to the Grid layer in the Schematized Layers group.
If it is necessary to update or change a small selection of elements, use the Roughness layer in the User Layers group.
Troubleshooting#
The Roughness layer must be a polygon layer. It is usually a shapefile.
The layer CRS must match the project CRS.
The polygon geometry must be valid to process the intersection area average. Try Check Geometries if the calculation fails.
If a Python error appears during the sampling process, it may indicate that attribute table is missing. Save and reload the project into QGIS and try again.