
Boundary Conditions and Buildings#
Overview
The last lesson demonstrated how to set up a hydrological project. However, the water was accumulating at the downstream region of the watershed. This lesson will outline how to add a floodplain outflow boundary condition.
Required Files
This lesson does not require any external data.
Important
The lesson is missing Building application but the video shows the process.
Step 1: Outflow boundary#
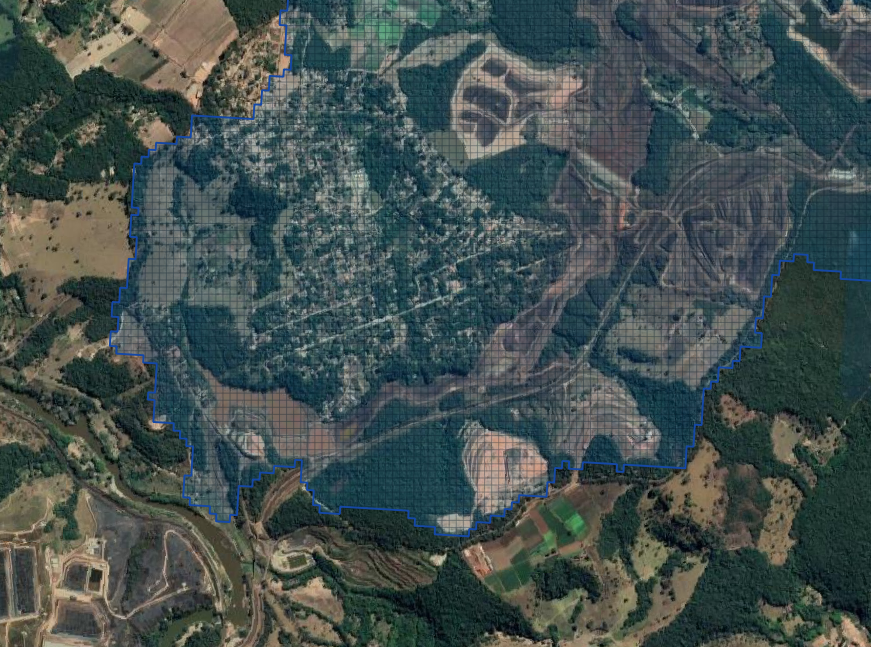
Locate the downstream end of the watershed.
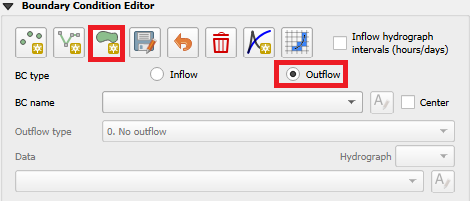
Expand the Boundary Condition Editor, select the BC type as outflow and click on Add Polygon BC.
Draw a polygon at the downstream end of the watershed. This polygon will add boundary conditions only to the cells at the limit of the watershed.
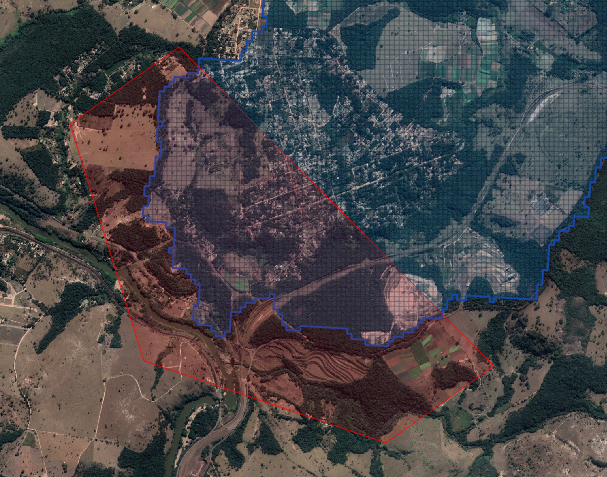
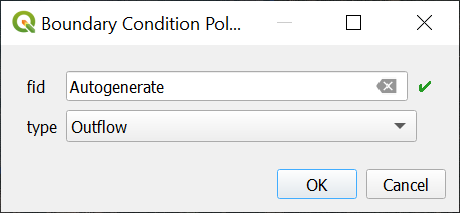
Right click anywhere on the map to finish editing this polygon. Select the type as Outflow.
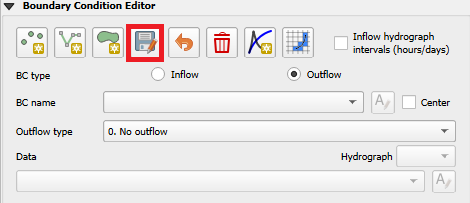
Click on Save Current BC under Boundary Condition Editor.
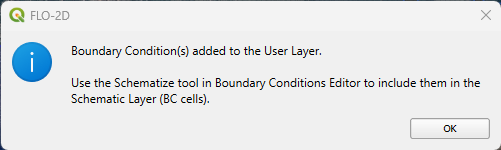
Click OK to close the message.
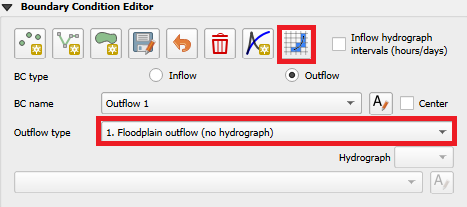
Select the Outflow type as 1. Floodplain outflow (no hydrograph) and click on Schematize Boundary Conditions.
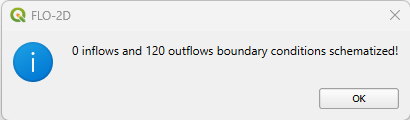
Click OK to close the message. The number of boundary conditions schematized may change depending on the size of the polygon drawn. It is OK if the number of outflows does not match this image.
Step 2: Add Buildings#
Open the 3. Boundary/data folder and drag the file Buildings.shp onto the map space.
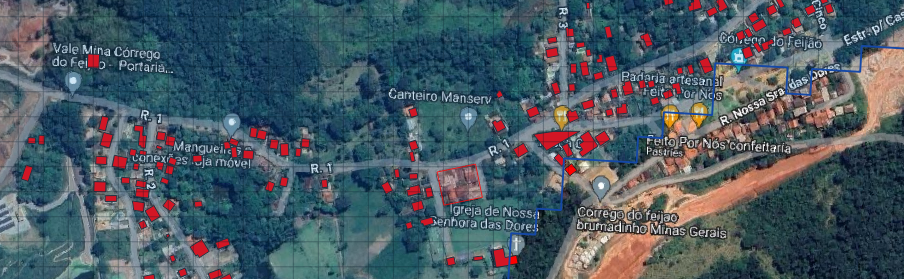
These buildings were extracted from a plugin called OSM downloader. OSM downloader will download all polygons from Open Street Map. The MultiPolyons from OSM downloader must be extracted to a Buildings shapefile and saved with the correct Project CRS.
The new layer has all landuse polygons. The buildings are separated, and any non-building polygons must be deleted.
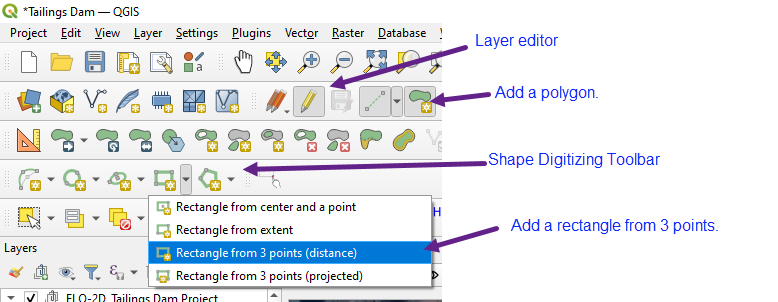
If a building is missing from the map, it can be added using the Shape Digitizing tool.
Edit the Buildings layer and add a Rectangular polygon to cover the buildings in the Aerial images.
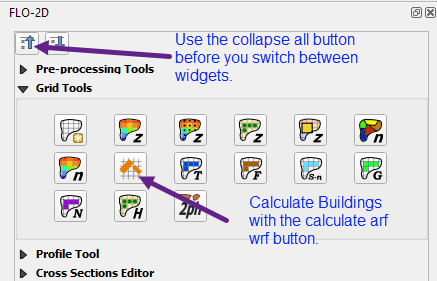
Click the collapse button and then expand Grid Tools. Click the calculate ARF WRF button to add buildings to the grid. Set the Collapse, ARF, and WRF buttons and click OK.
The collapse field switch will allow the building to collapse if the flooding exceeds a certain depth on the building cell.
The ARF field tells the algorithm to apply the volume displacement for the building on the grid element.
The WRF field tells the algorithm to apply the flow redirection around the grid element if a building is on the edge of a grid element.
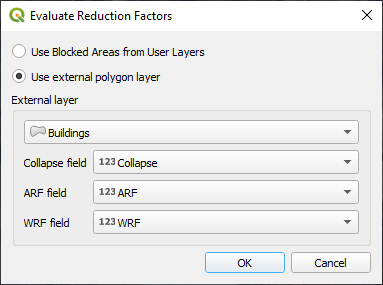
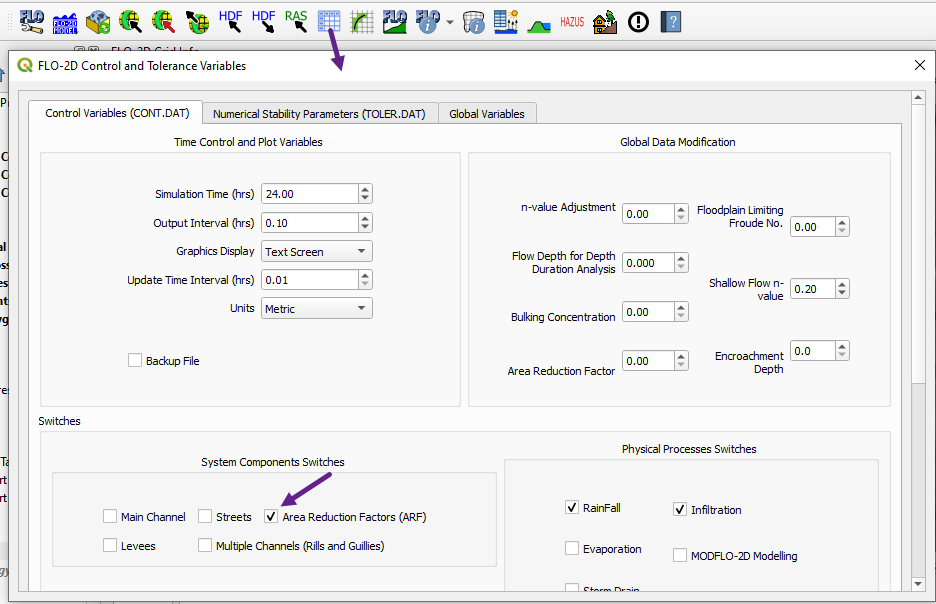
Turn on the ARF switch.
Step 3: Export and run#
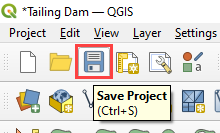
Click the main Save icon on the QGIS toolbar.
Click the FLO-2D Data Export icon.

Make sure that the Outflow Elements is checked.
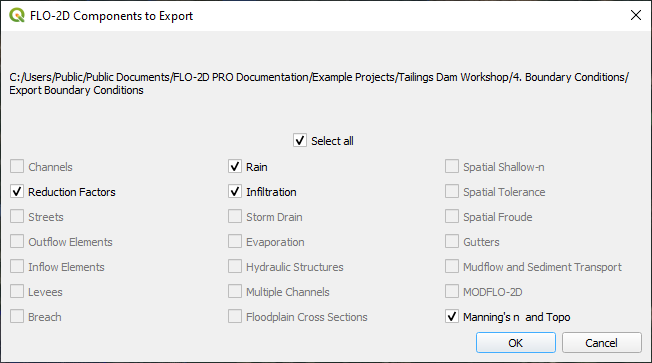
Set the export folder to Export Boundary Conditions. The Project Folder on the Run Settings is automatically updated to the new Export Boundary Conditions folder and it does not need to be updated.
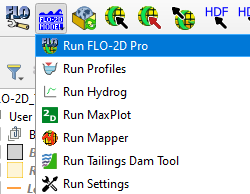
Click on the Run FLO-2D icon to run the simulation.
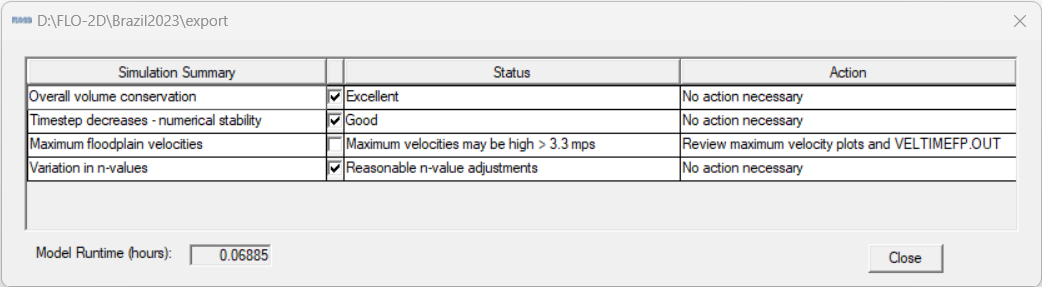
Check the simulation summary for any errors.
Step 4: Load new results#
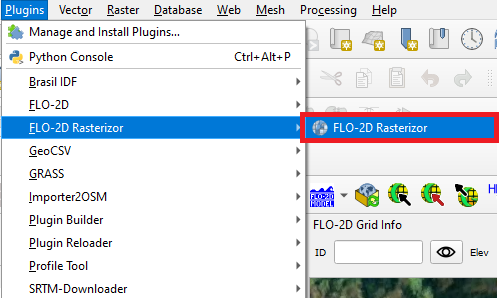
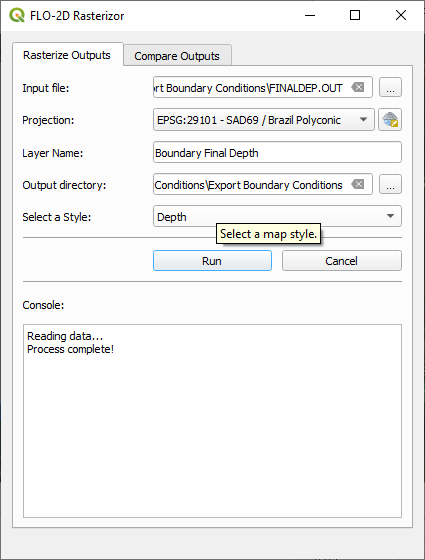
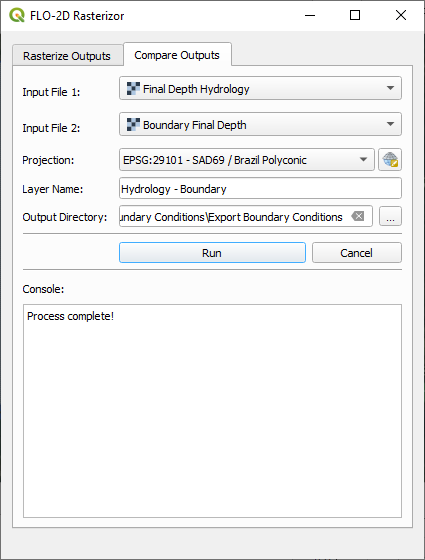
Create the new final depth map with Rasterizor.
Select the FINALDEP.OUT file in the Export Boundary Conditions folder. Name the layer Final Depth BC, select the Output Directory as the Export Boundary Conditions folder and select Depth as style.
Switch to the Compare Outputs tab and calculate the Hydrology Final Depth – Boundary Final Depth to calculate the difference between the rasters.
Close Rasterizor.
Step 5: Compare results#
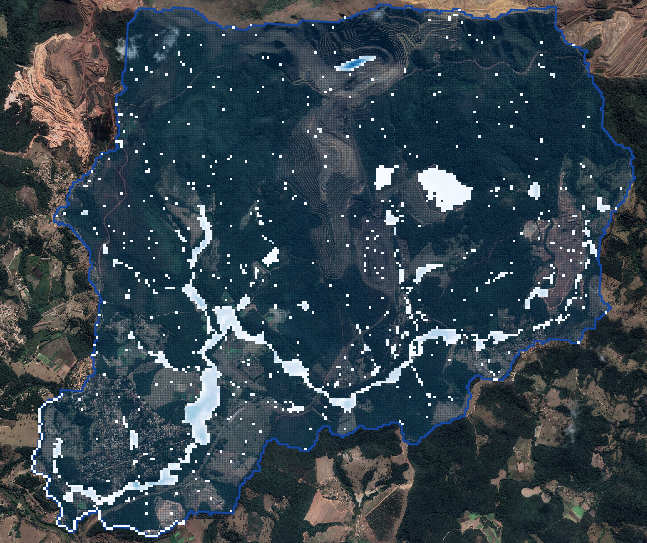
Compare the downstream results.
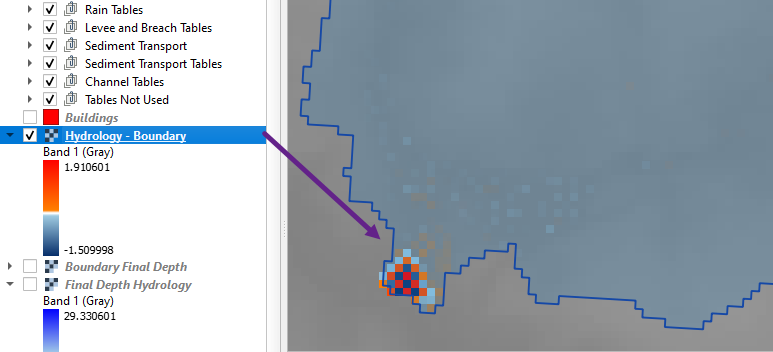
The water accumulates at the downstream end of the watershed when no outflow boundary condition is set. This is possible to visualize in the darker blue values on the left screenshot. When the outflow boundary condition is set, the water flows out the computational domain, showing whiter values. The boundary condition is normal depth.
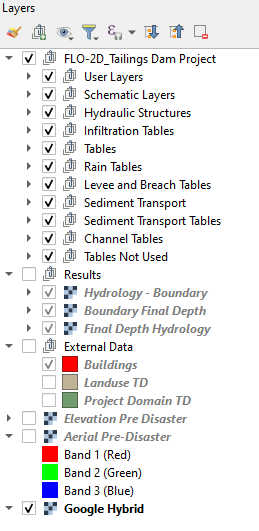
Step 6: Organize the map layers#
Group the External Data and the Results and move the Aerials and Elevation maps to the bottom of the map.
Save and close QGIS because the next lesson uses a different project.