
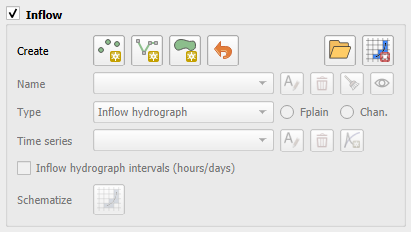
Inflow Editor#
Any number of inflow hydrographs to the FLO-2D model can be assigned to channel, floodplain or even the 1-D street component. This represents a flood inflow to the flow domain from an off-site source.
Create Inflow Data#
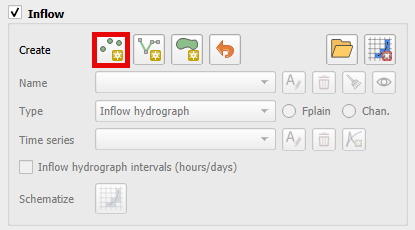
To create a point of inflow, click the Add Point BC button on the Boundary Condition Editor widget.
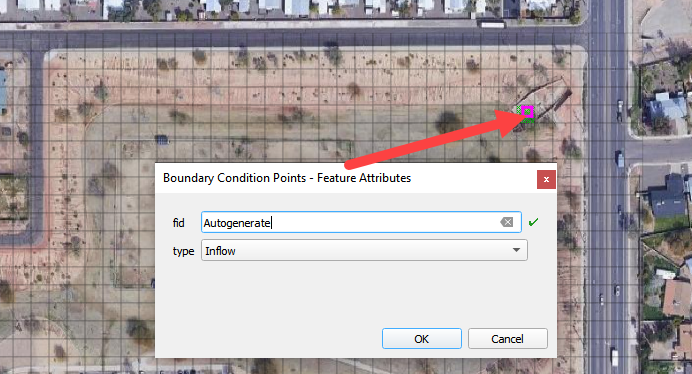
Digitize the inflow node by left clicking the location of the inflow node on the map. In this example, the inflow node is a channel inflow node. It is not necessary to enter the fid. Click OK to create the feature.
Click again the toggled Add Point BC button to save the feature.
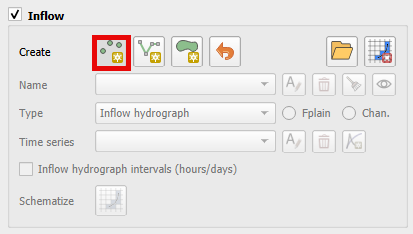
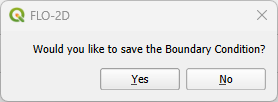
Click Yes to save the feature and to load the data into the editor.
Note
It is possible to add a line or a polygon inflow by using the Add Line BC or the Add Polygon BC buttons.
Load Inflow Data#
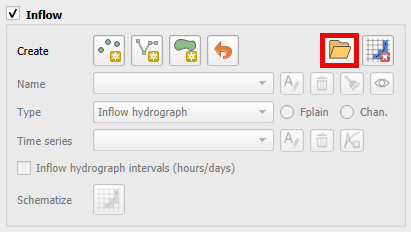
To load an INFLOW.DAT file, click on the Open INFLOW.DAT button.
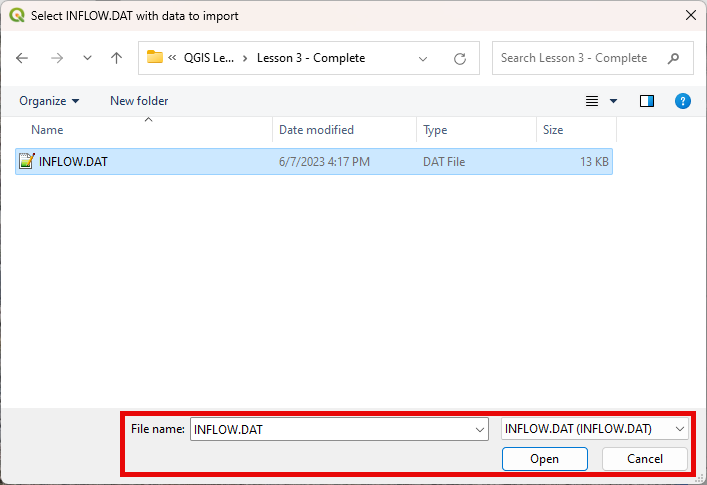
Navigate to the folder containing the INFLOW.DAT file and select it.
A message on the QGIS toolbar will appear, indicating that the importing was successful.
Note
Loading the INFLOW.DAT file into the project appends data to the Boundary Condition layers/table, updating cells if already defined with a Boundary Condition. Additionally, all data added using this tool will be included in the Boundary Conditions Points User Layer.
Assign Conditions to the Inflow Boundary Conditions#
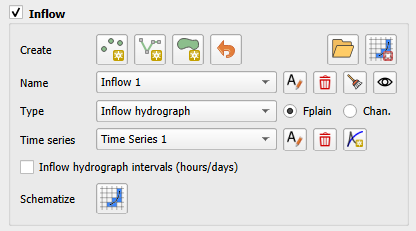
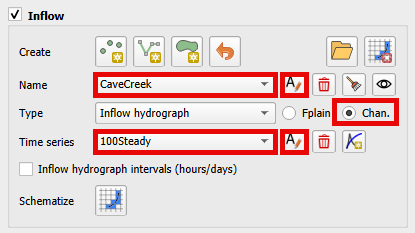
Assign the conditions to the inflow node as seen in the following image. This example the inflow node will have a steady hydrograph with 100 cfs assigned to Cave Creek inflow node.
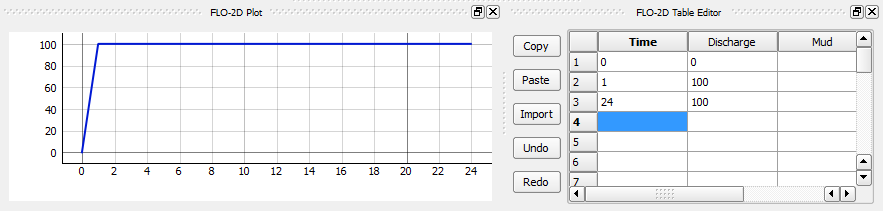
The time series inflow hydrograph is assigned in the table editor where time is in hours and discharge is cfs or cms. This is a clear water inflow hydrograph and no sediment concentration is assigned.
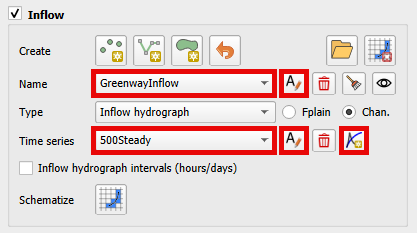
Repeat the process to add additional inflow hydrographs. Use the Add data series/table for current BC button to create a new hydrograph.
Note
Click on the lock into the selected inflow boundary condition button to highlight the selected inflow boundary condition on the Map Canvas when changing the Inflow Boundary Condition combobox.

Delete Selected Inflow Boundary Condition#
To delete an Inflow Boundary Condition, click on the Delete Inflow Boundary Condition button.

Note
This button exclusively deletes the selected user Inflow Boundary Condition on the Boundary Condition Editor from the User Layers.
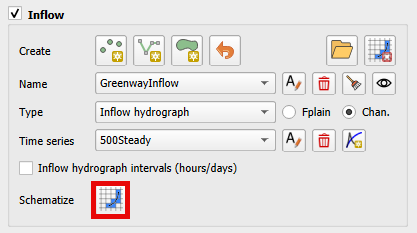
Schematize the data#
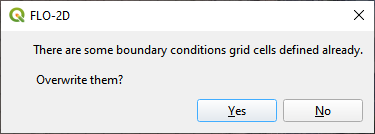
Use the Schematize button (shown below) to save the data to the Schematic Layers and click Yes to overwrite the layers.
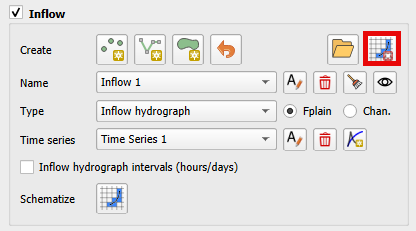
Delete Schematized data#
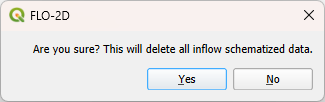
To delete all schematized Inflow Boundary Conditions, click on the Delete Schematized Inflow Boundary Condition button and click Yes to delete all schematized Inflow Boundary Conditions.
Note
This button removes all schematized Inflow Boundary Conditions data, excluding the time series.