
4. Grid Elevation from LiDAR#
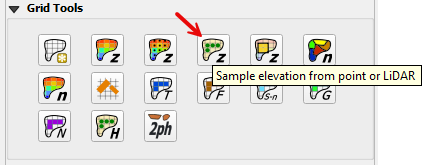
This tool is used to sample elevation from imported points layer or external LiDAR xyz files.
LiDAR xzy Method#
Note
This is the best method for interpolating point data. Even if the data is not LiDAR data, this method is preferred. For example, if the data is exported from a Civil 3D surface as points, use this method.
The LiDAR method can interpolate data from multiple files. It applies a simple average to the point within a cell and can patch missing LiDAR elevation from areas that are filtered from the ground data category.
Click the Assign Elevation to Grid button to interpolate the elevation data to the grid.
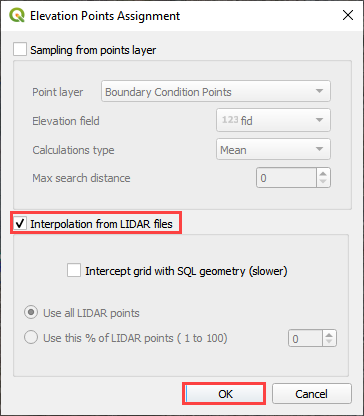
Choose the Interpolate from LiDAR files option and click OK.
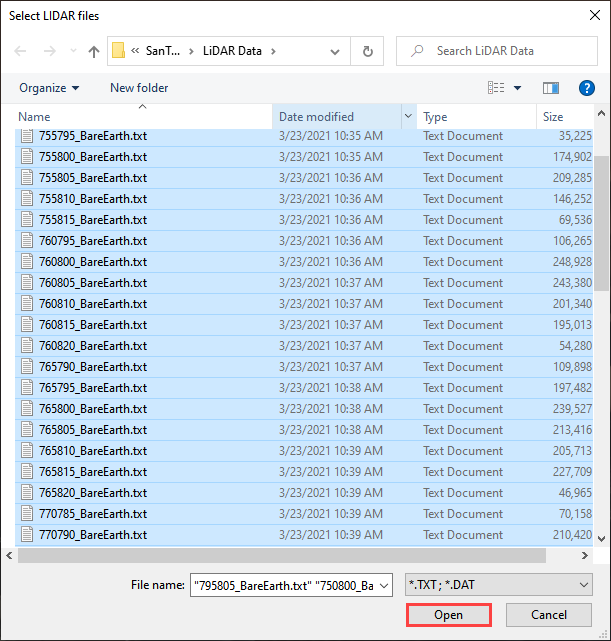
These files are created from LasTools using the LiDAR *.LAS files and the position is identified by a tiles shapefile. Each filename has a distinct tile associated with it. The LiDAR xyz file must have a *.txt extension.
Select the files and click Open.
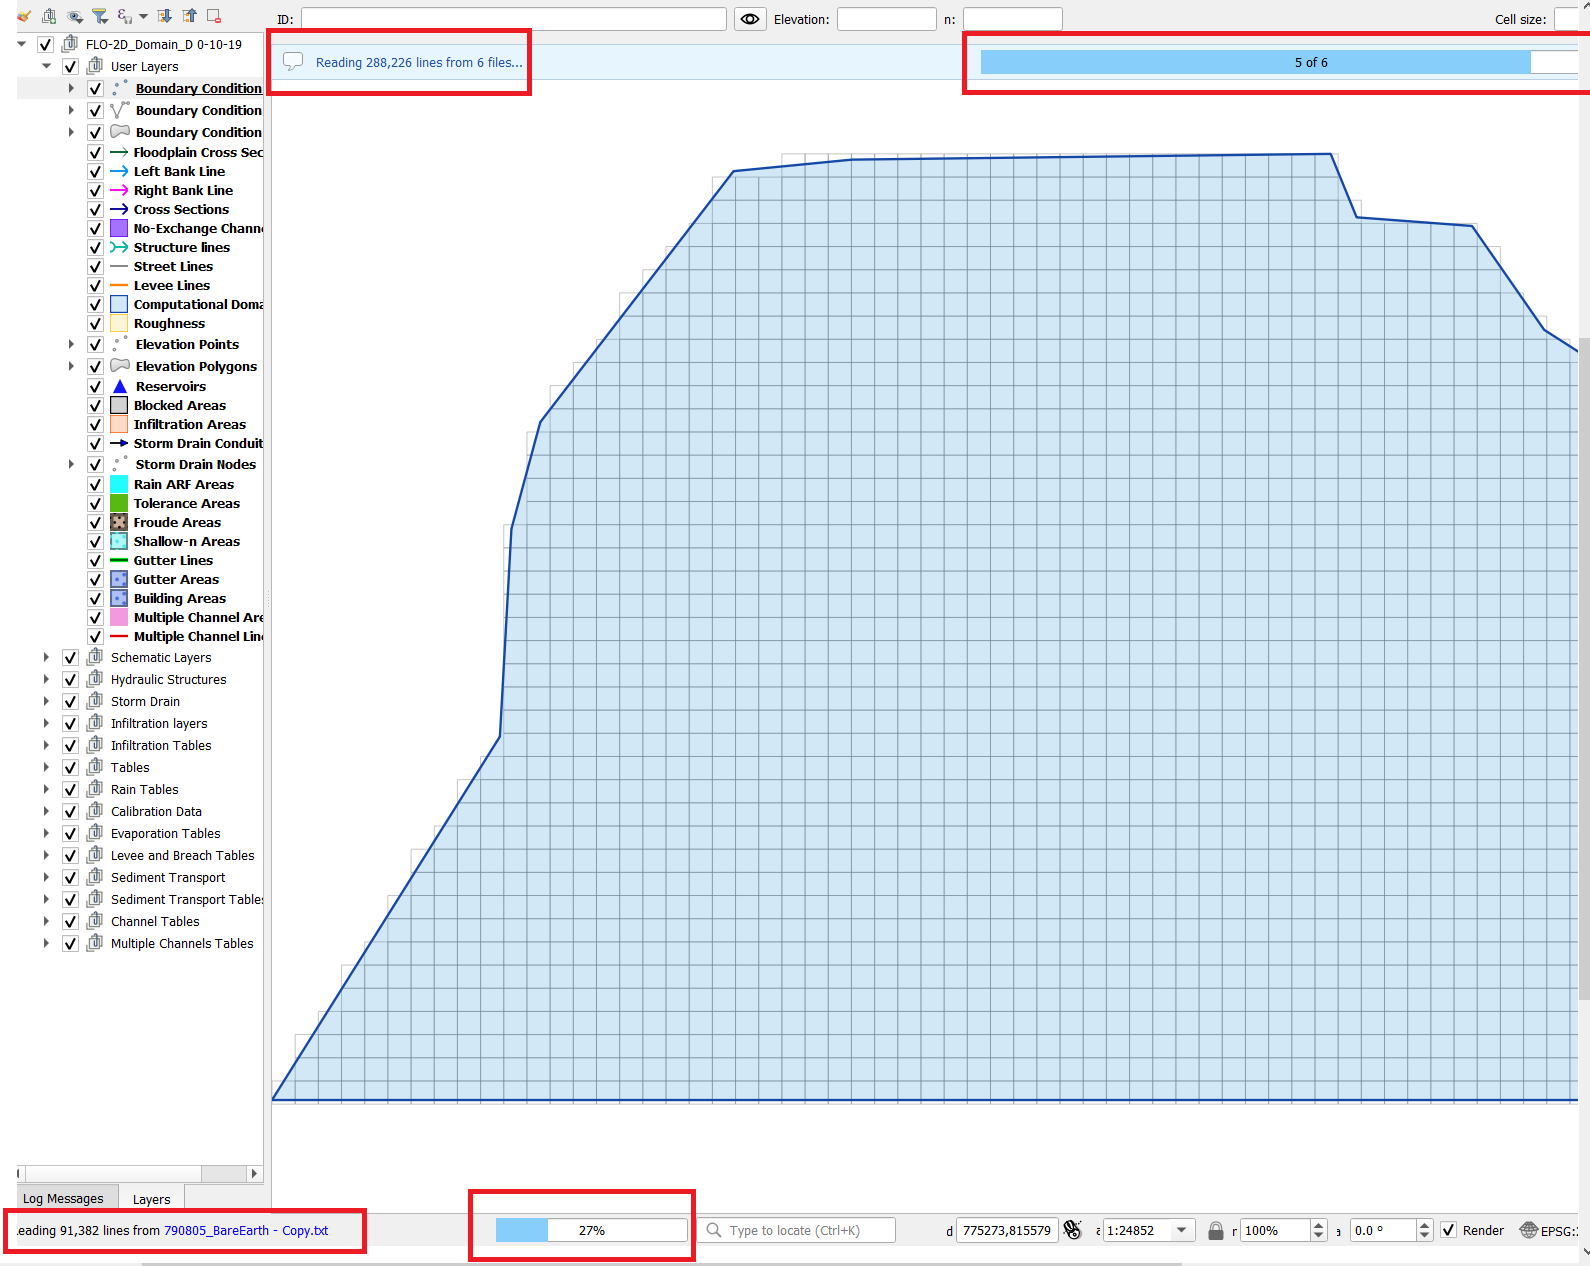
When the file is processing, two progress bars can be seen in QGIS.
Once the processing is complete a dialog box appears with information about the processing points and time. Click OK to close this window.
LiDAR data is bare earth data so categories such as buildings, bridges, overpasses are removed from the point data.
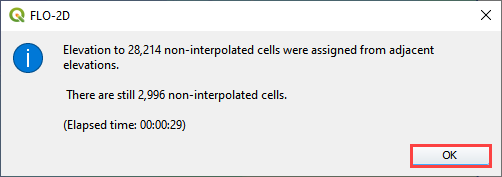
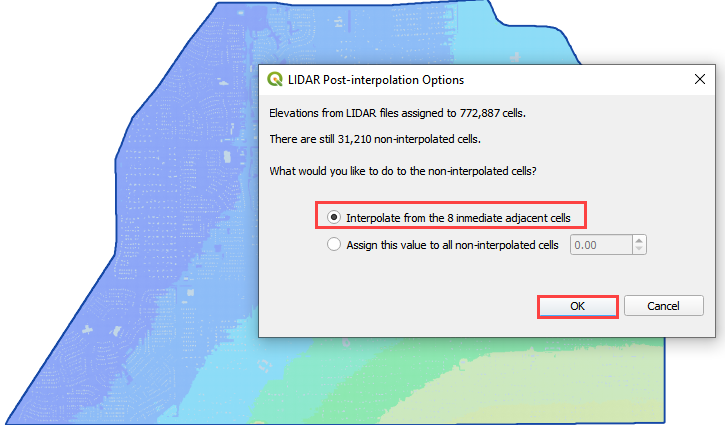
The plugin will color the grid layers so that elevation data can be identified and allow the user to fill this data with a nearest neighbor patch or assign a value to non-interpolated cells. Select the first option and click ok to fill the missing data and click OK.
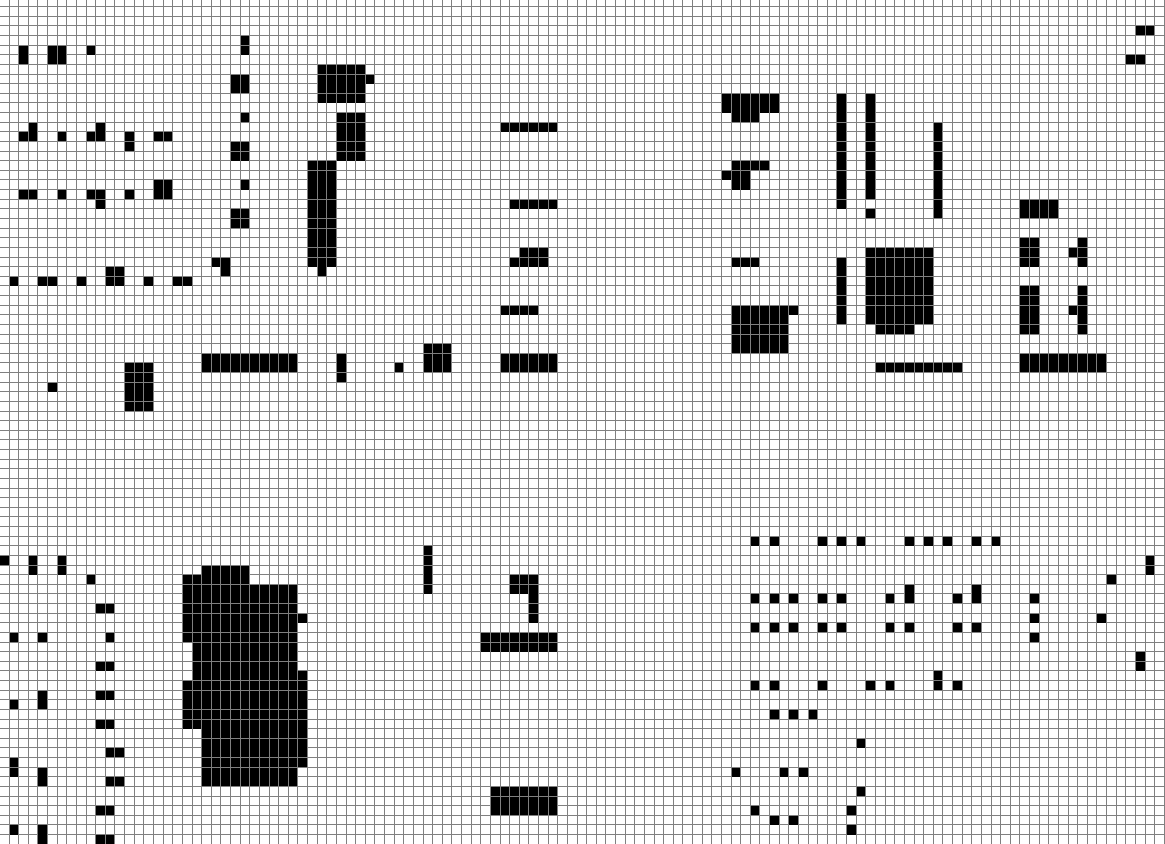
This system may cycle a few times until all cells are filled. Once the cells are filled, it is OK to cancel the dialog box.
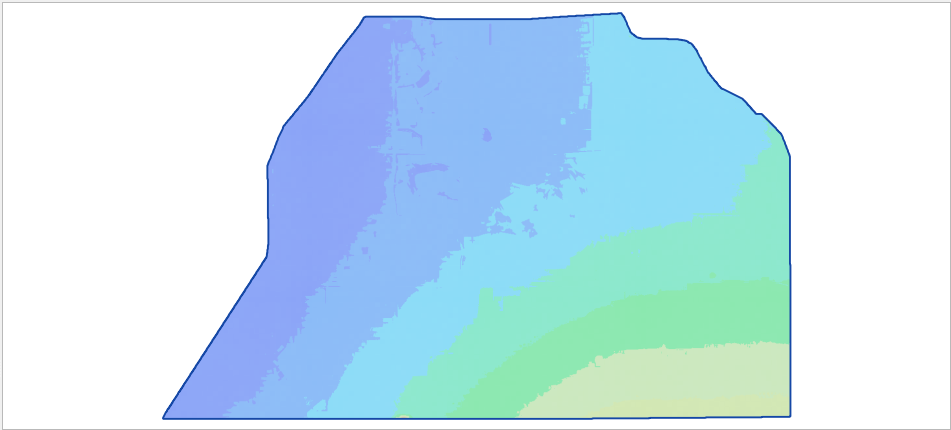
The final results should be a grid with all elevation data complete.
Elevation Point Method#
Load the data#
Note
This method is not the recommended. It is slow and requires that point data be imported into the map before use. Use this method if elevation point data is provided in a vector format.

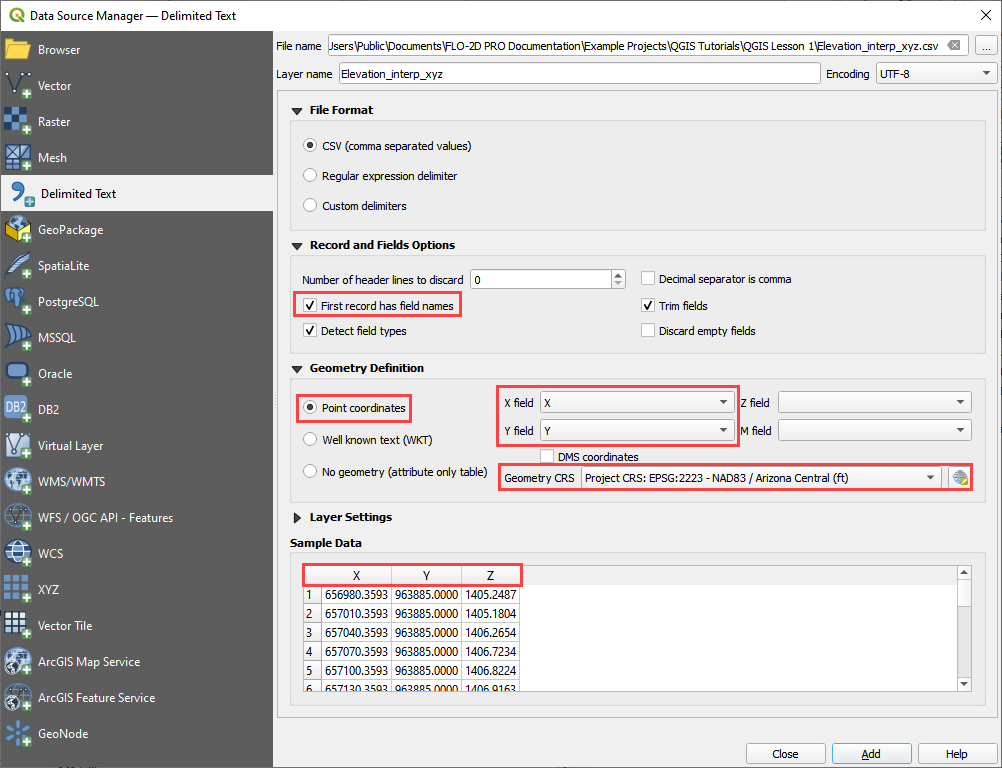
Click on Layer>Add Layers >Add Delimited Text Layer or click on the Open Data Source Manager button and navigate to the Delimited Text tab. Add the delimited text data, following the figure below.
There are many options to help sort the data. Select the options that reflect the desired dataset and click add.
Apply a Style#
The data has a default style so it isn’t very easy to view elevation.
Adjust the Style properties of the elevation data to assist the quality control measures for reviewing the data. For example, elevation data that has a large range can wash out the detail in local areas of the project area.
Double click the layer to open the Properties window and select the style tab to perform the following.
Assign graduated colors;
Select field to represent colors;
Select color ramp;
Classify the data (classifying the data adjustments will assist in locating erroneous data).
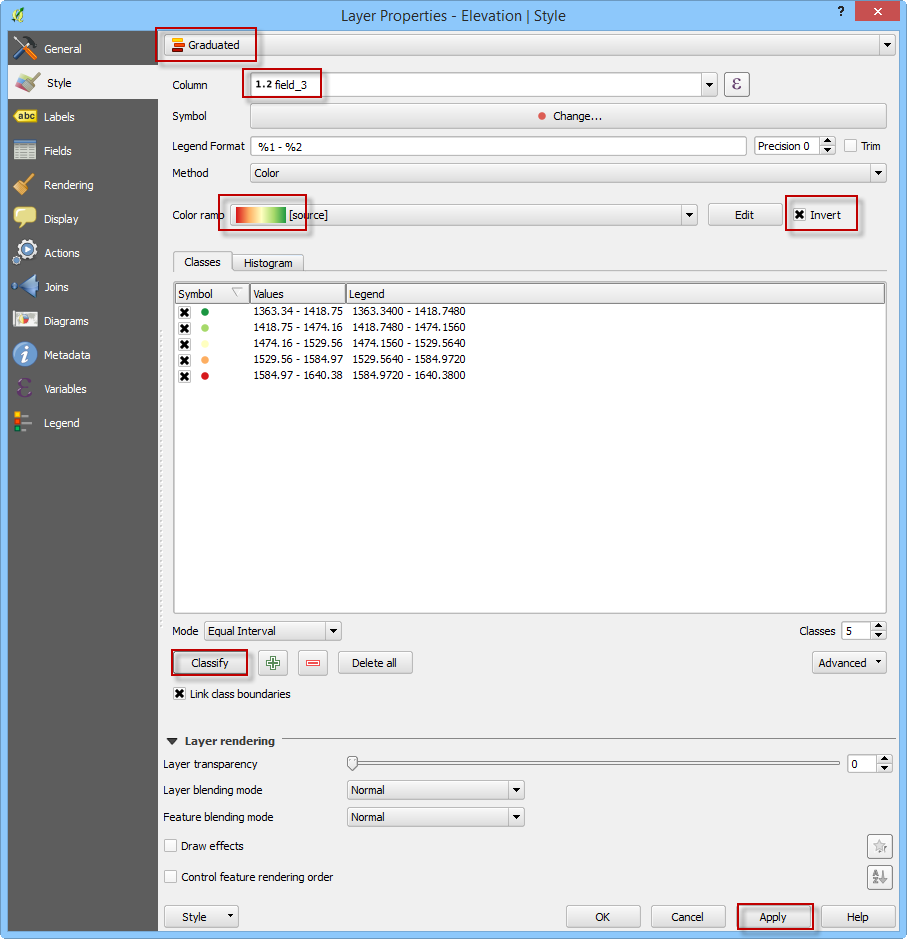
The point data style is a graduated color scheme set to the elevation scale (see the figure below).
Sample Data#
Click the Assign Elevation to Grid button to interpolate the elevation data to the grid.
The sampling dialog box appears to select the point source, elevation field, and calculation type.
Choose a max search distance to extend the search for empty grid elements. The distance is in the native map units.
This field can be assigned a zero value to default to the minimum search distance.
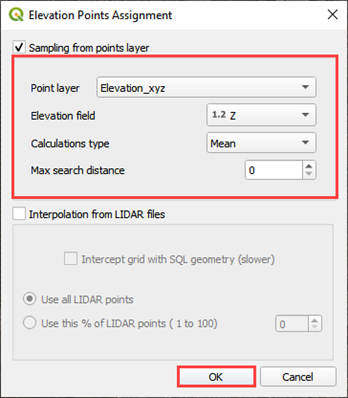
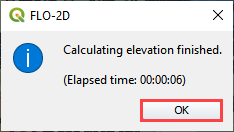
Once the calculation is complete, the following dialog is displayed. Click OK to continue.
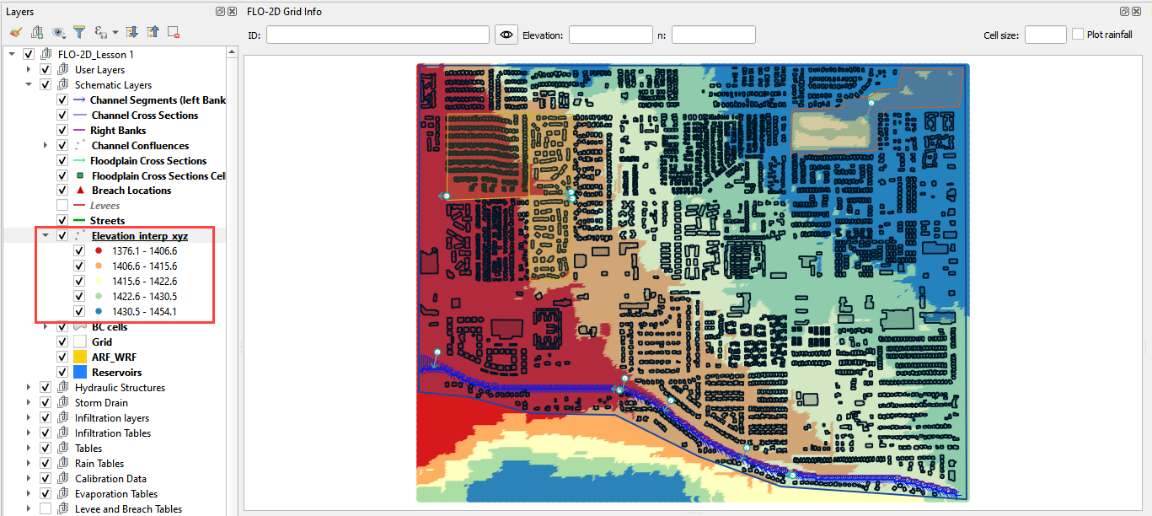
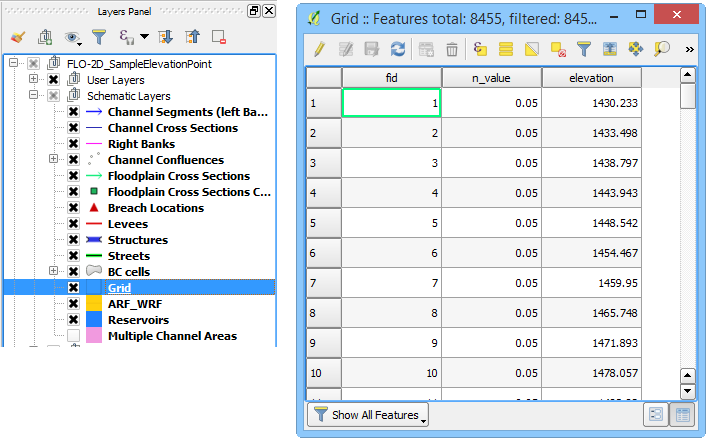
The elevation data is saved to the Grid Layer in the Schematic Layers group.
Troubleshooting#
If the elevation data is not visible, check the CRS. It may be necessary to transform the data into the correct CRS.
If the elevation layer does not show up in the Sample Elevation Dialog box, make sure it is a point layer and that it is checked on in the Layers List.
If a Python error appears during the sampling, it may indicate that there is no attribute table. Save and reload the project into QGIS and try again.
If the LiDAR xzy method reveals a blank patch of data, a text file is likely missing. Ensure complete coverage of the project area.