FLO-2D Results Tool#
The results tool is used to see results by location for specific components.
Connect to the Data#
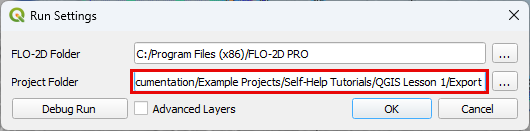
Start by loading the completed simulation folder into the Run FLO-2D - Settings Tool.
Note
The FLO-2D Project folder is updated everytime that files are exported. Double check path before using the tool.
Activate the Tool#
The tool is a toggle. Click FLO-2D Results button to activate it.

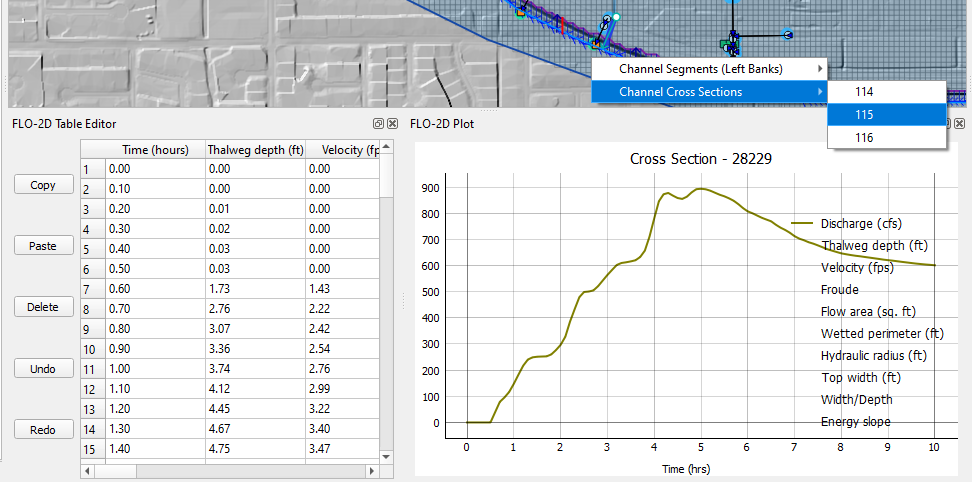
Click on any component on the map. If the component has active results, a selector will appear.
Click the plotting panel to select the data to be plotted.
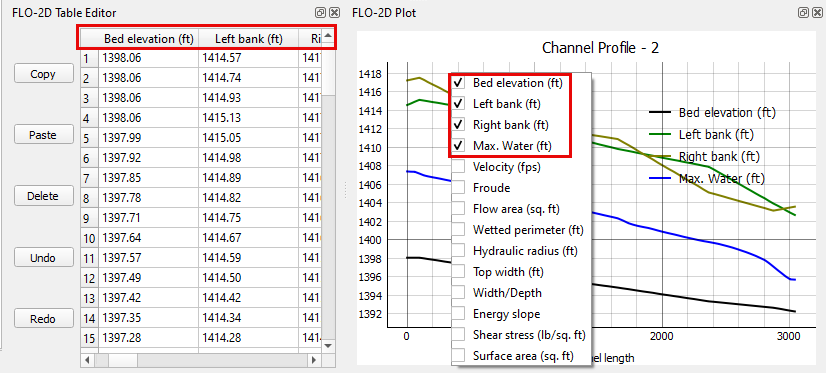
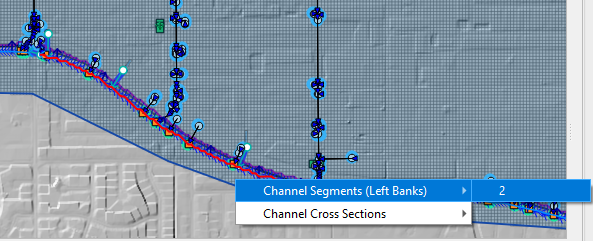
Channel Results#
Click a left bank line to plot the water elevation profile.
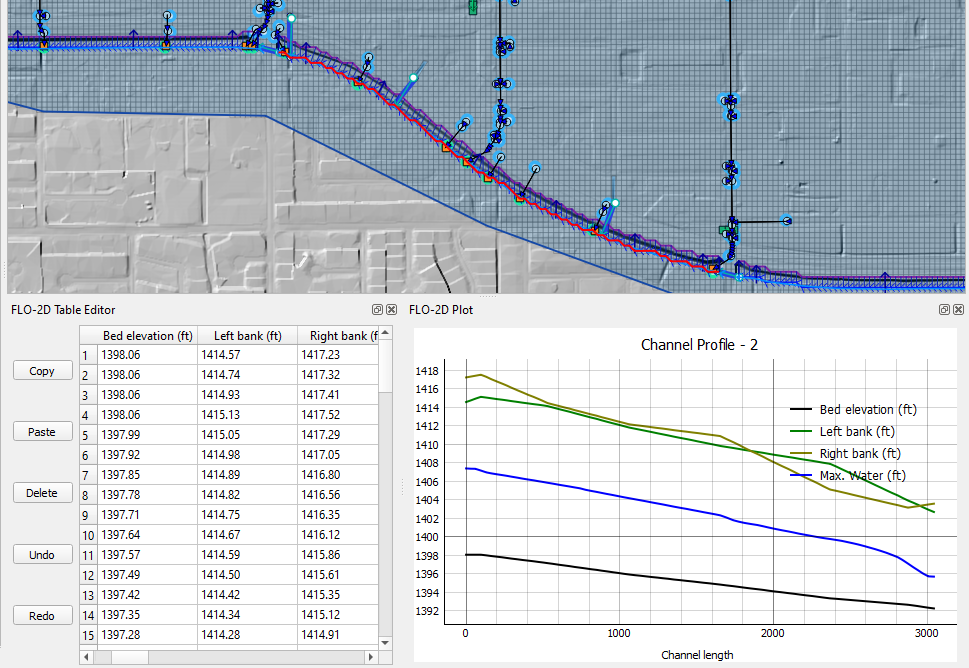
Click a cross section to plot the results reported in the HYCHAN.OUT file.
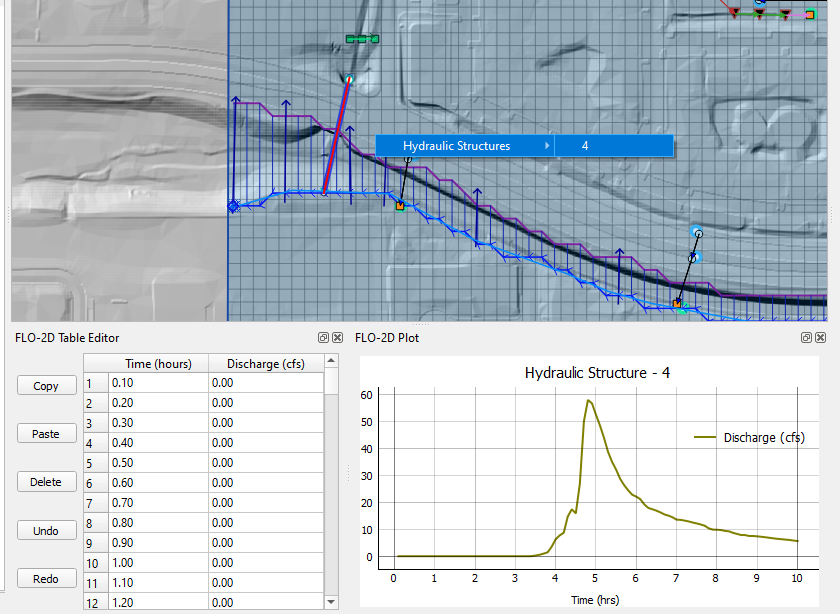
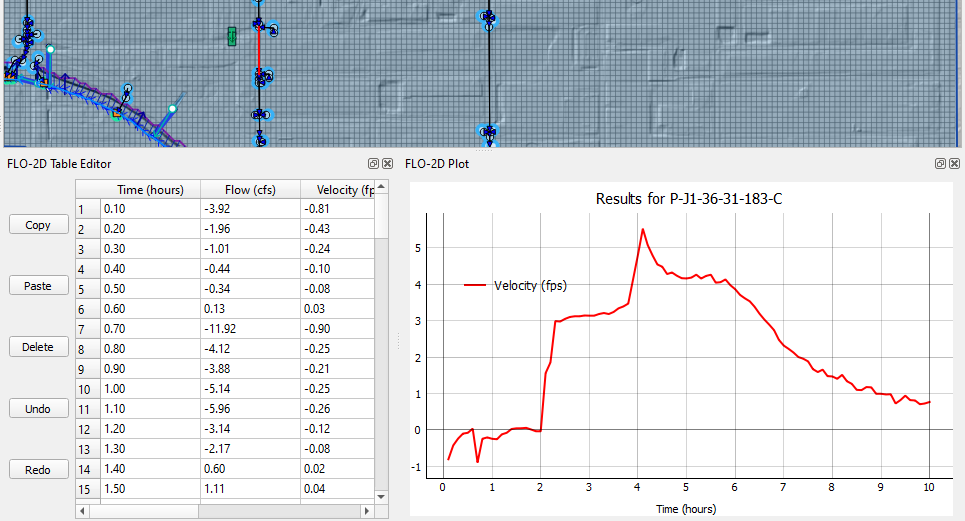
Hydraulic Structure Results#
Click a structure to plot the time discharge plot.
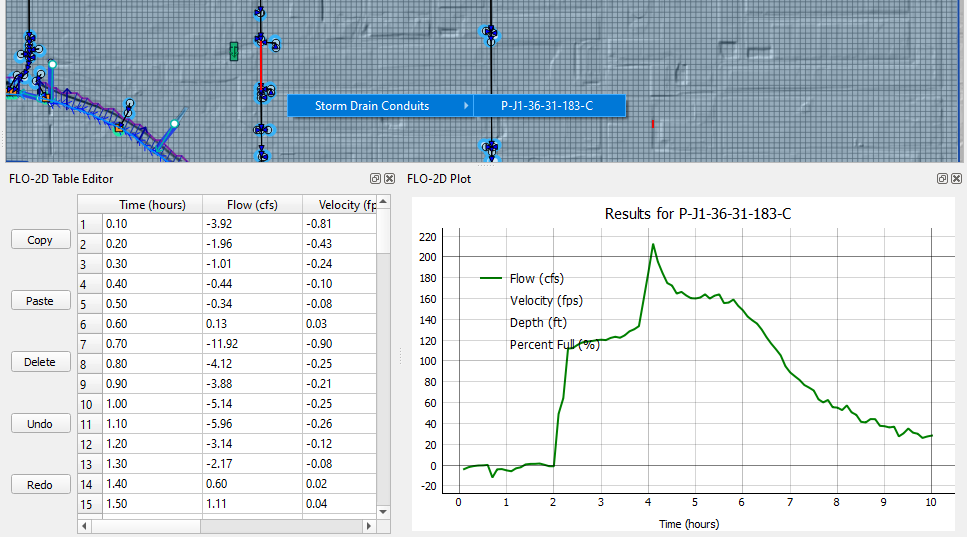
Storm Drain Results#
Click any storm drain feature to load the results in the table and plotting panel.
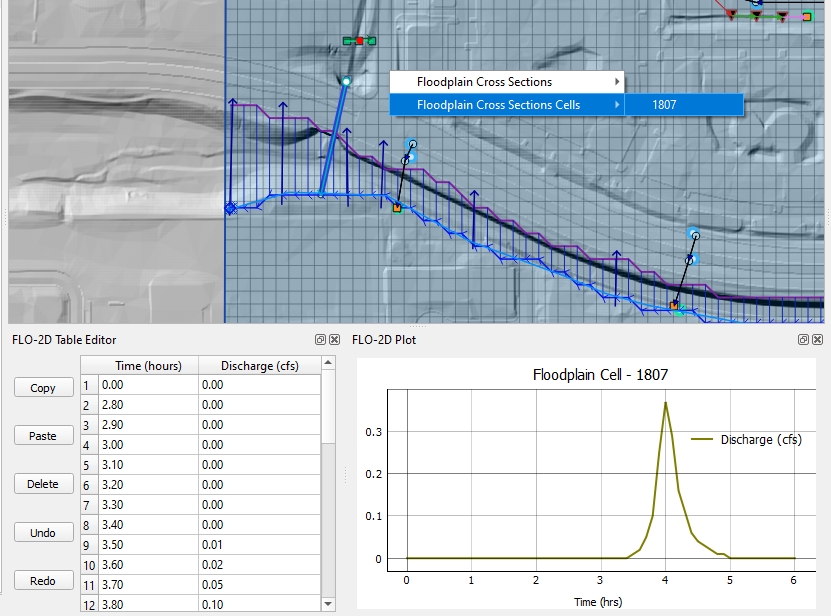
Floodplain Cross Section Results#
Click any floodplain cross section to load the results in the table and plotting panel.
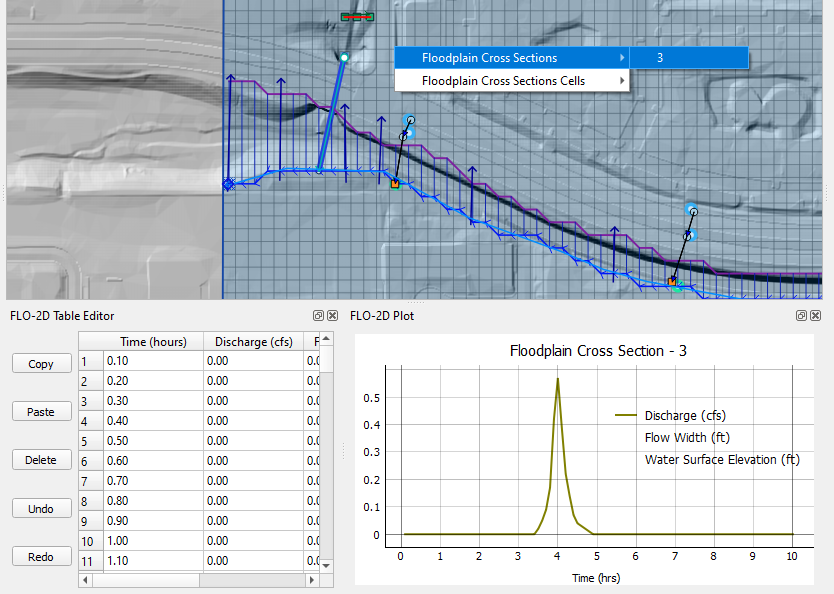
Click any floodplain cross section cell to load the results in the table and plotting panel.