Profile Tool#
The profile tool is primarily used to review the channel profile but can also be used to review table data for specific features.
Raster Profile#
Create a Raster
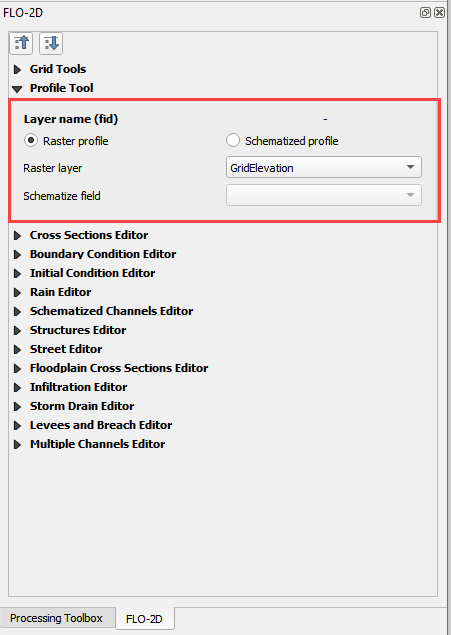
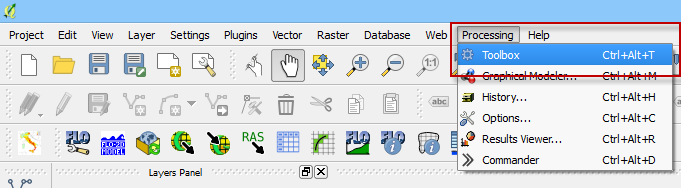
Set up the raster in the Profile Tool widget. In this example, the grid elevation raster is used. To create a grid elevation raster, use the Saga-Rasterize tool. On the Main QGIS Menu, click Processing>Toolbox.
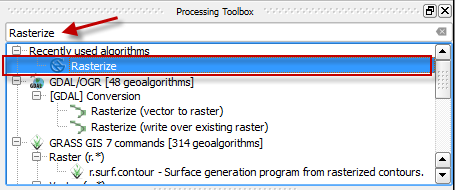
Enter the search term Rasterize in the Processing Toolbox search feature. Double click the Saga Rasterize tool.
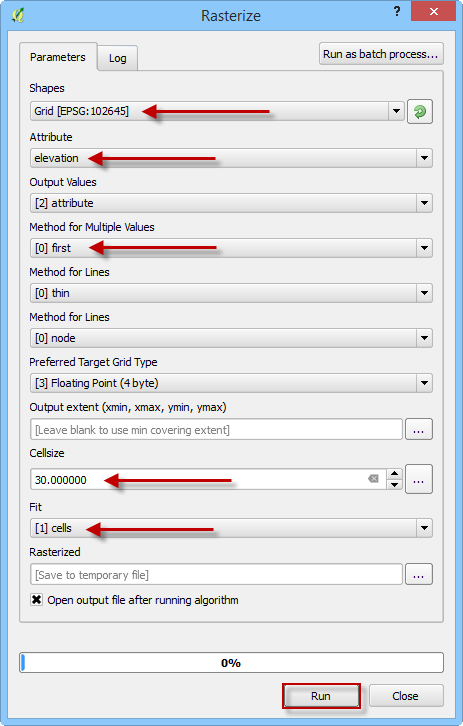
Change the dialog box as shown below and click Run. Cell size is the grid element size. Fit = cells will ensure that the raster pixels are centered on the grid elements. Saga-Rasterize is a good raster generator for FLO-2D data because it builds a raster with hidden null data. QGIS has many raster generators, and they all work slightly differently.
The raster that is created is a temporary layer called Rasterize. This layer should be saved to a permanent layer using the QGIS Save As feature. This feature is found by right clicking the layer.
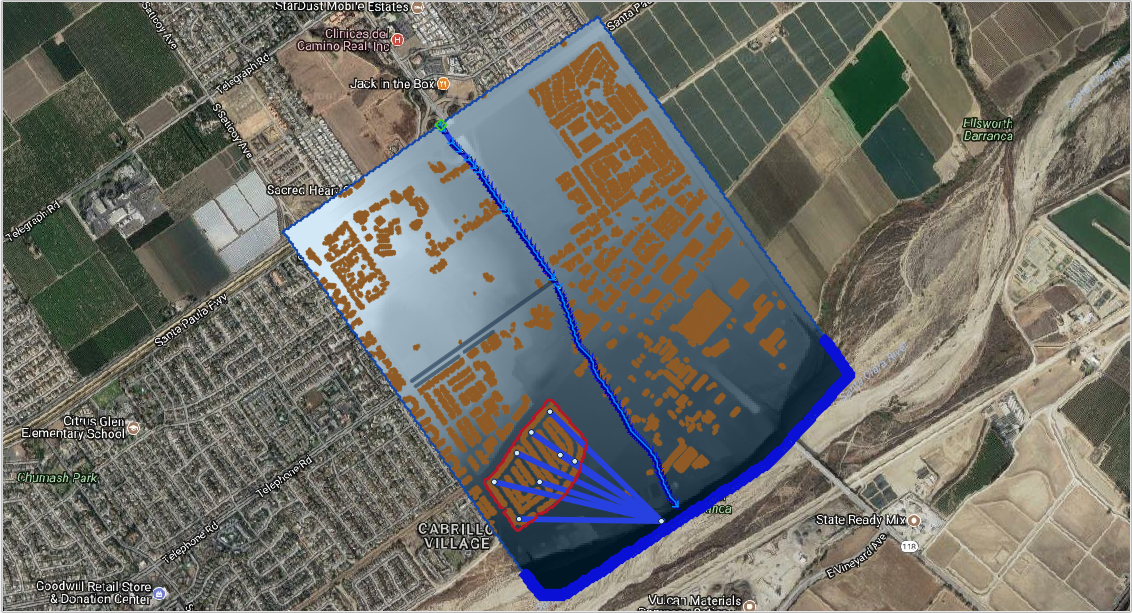
Plot a profile of a polyline on the raster.#
The profile tool works for Levee, Channel and Street polylines that are digitized in the user layers only. This example will test it on a channel polyline.
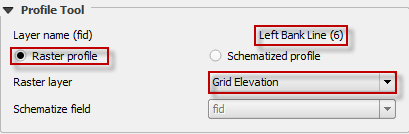
Click the Raster profile radio button and set the raster. This example uses Grid Elevation raster.
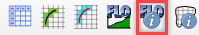
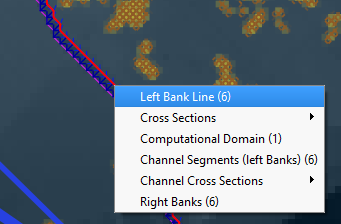
Click the FLO-2D Info Tool and click on a channel segment.
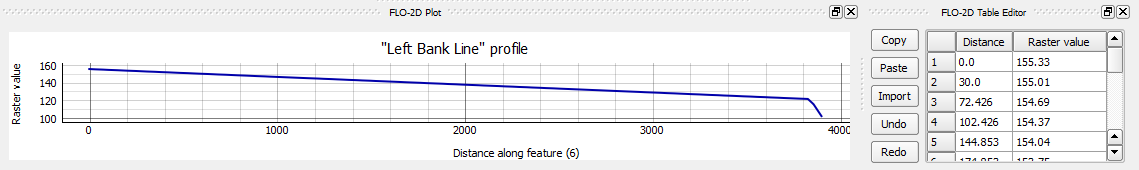
Select the segment and the elevation profile along the segment line is plotted in the FLO-2D Plot area and the Raster data along the channel line is printed to the FLO-2D Table. Any data that can be rasterized can be plotted in this manner. The table can be copied to an Excel sheet and saved.